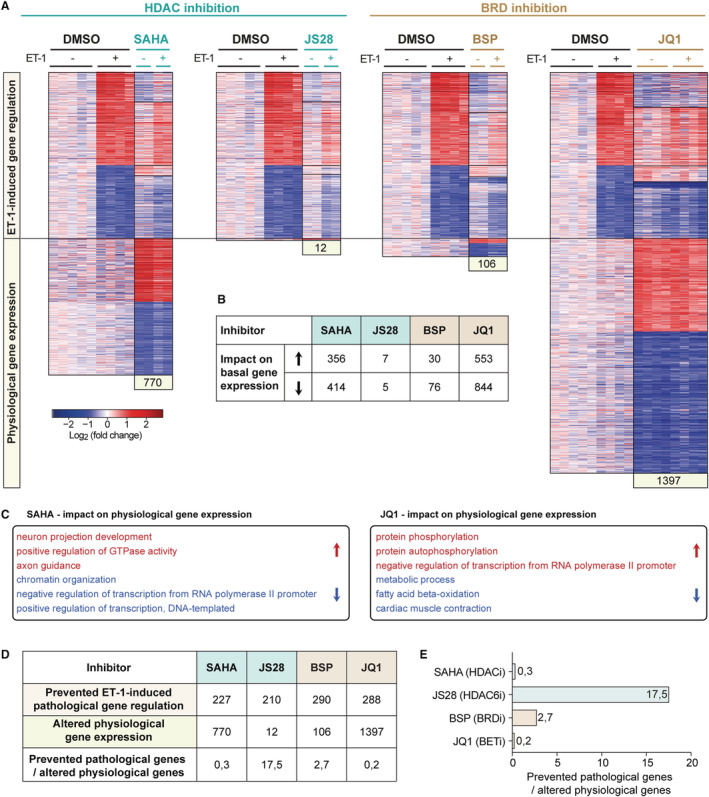
Figure 5. Impact of epigenetic inhibitors on physiological gene expression.

A, Heat maps showing the effects of epigenetic inhibitors on genes differentially expressed after treatment with endothelin 1 (ET‐1, upper panel) and on physiological gene expression (lower panel) (normalized counts >1, q<0.05, 1.5‐fold up−/downregulated, n=2–5). B, Numbers of genes differentially up‐ or downregulated by the respective inhibitor in absence of ET‐1. C, Gene ontology analysis of genes differentially regulated by SAHA (vorinostat) or JQ1 (normalized counts >1, 1.5× up−/downregulated, q<0.05). D and E, Numbers of genes regulated by ET‐1 and prevented from being regulated by epigenetic inhibitors compared with the impact of epigenetic inhibitors on physiological gene expression, implicating desired vs undesired effects. BRD indicates bromodomain‐containing protein; BSP, bromosporine; HDAC, histone deacetylase; and SAHA, suberoylanilide hydroxamic acid.
