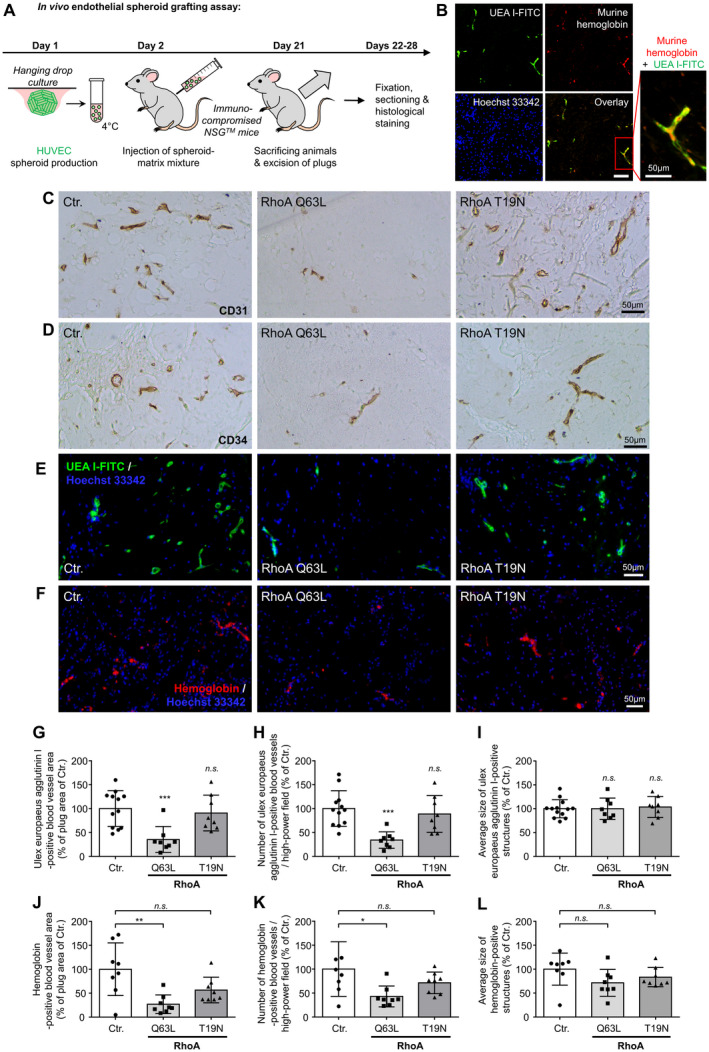
Figure 5. In vivo blood vessel formation is affected by RhoA (Ras homolog gene family, member A) activity.

A, Schematic illustration of the experimental setup of the human umbilical vein endothelial cells (HUVEC) spheroid‐based grafting assay in immunodeficient NSG mice. B, Colocalization of fluorescein‐5‐isothiocyanat‐labeled (FITC) europaeus agglutinin I (UEA I) and murine hemoglobin‐positive blood vessels. Scale bar=100 µm. C and D, Representative microscopic pictures of xenograft plug sections stained for visualization of endothelial cell markers CD31 and CD34 (cluster of differentiation 31/34). E, Representative microscopic pictures of xenograft plug sections stained with FITC‐labeled Ulex europaeus agglutinin (UEA I‐FITC) for selective visualization of the vascular network derived from embedded HUVEC. Nuclei were stained with Hoechst 33342. F, Representative microscopic images of sections of xenograft plugs stained with an antibody directed against murine hemoglobin to selectively visualize humanoid blood vessels within the plug that are connected to the murine host circulation. Nuclei were stained with Hoechst 33342. G, Blood vessel growth was analyzed by quantification of the UEA I–positive blood vessel area per total plug area. The number of UEA I–positive blood vessels per plug area (H) and average size of UEA I–positive blood vessels (I) were also determined. ***P<0.001 vs control‐transduced (Ctr.) HUVEC (n=8–12). J, Quantification of the hemoglobin‐positive blood vessel area per total plug area. **P<0.01 vs control plugs (n=8). Determination of the number (K) and average size (L) of hemoglobin‐positive blood vessels per high‐power field. *P<0.05 vs control plugs. (n=8). n.s. indicates not significant; and NSG, NOD scid gamma.
