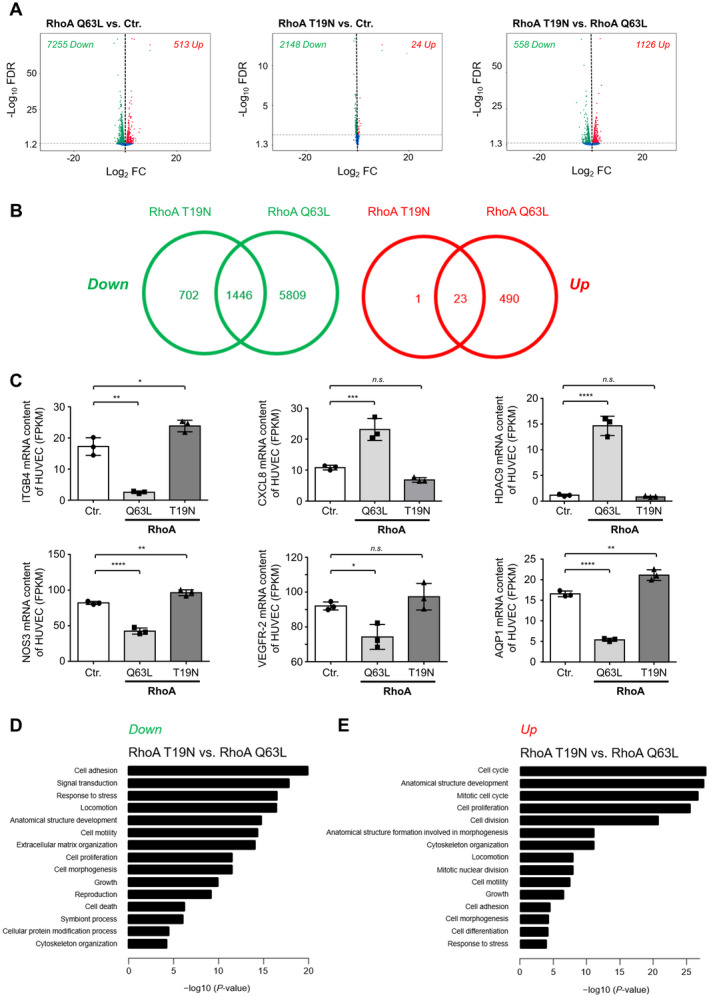
Figure 6. RhoA (Ras homolog gene family, member A) activity affects gene expression of human umbilical vein endothelial cells (HUVEC).

A, Volcano plots depicting differential gene expression in HUVEC expressing constitutively active (Q63L) or dominant‐negative RhoA compared with appropriate control‐transduced (Ctr.) cells as determined by RNA‐sequencing (RNA‐seq). B, Significantly upregulated (red; Up) or downregulated (green; Down) mRNA in RhoA Q63L‐ and RhoA T19N‐expressing HUVEC are depicted by Venn diagrams. Numbers indicate the number of transcripts with significantly deregulated expression in RhoA Q63L‐ and/or RhoA T19N‐expressing HUVEC. C, The abundance of ITGB4 (integrin subunit β 4), CXCL8 (C‐X‐C motif chemokine 8/interleukin 8), HDAC9 (histone deacetylase 9), NOS3 (nitric oxide synthase 3), VEGFR‐2 (vascular endothelial growth factor receptor 2), and AQP1 (aquaporin 1) mRNA were determined by RNA‐seq in control‐transduced as well as in HUVEC expressing active (Q63L) or inactive (T19N) RhoA. Results are shown as fragments per kilobase of transcript per million mapped reads (FPKM) (n=3). D and E, Top gene ontology biological process terms significantly enriched in upregulated (D) or downregulated (E) genes of RhoA T19N‐overexpressing vs RhoA Q63L‐overexpressing HUVEC. FC indicates fold change; FDR, false discovery rate; n.s., not significant.
