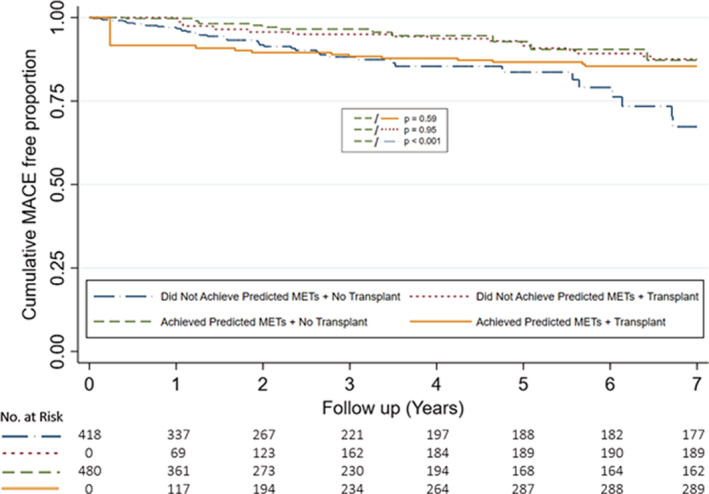
Figure 2. Cumulative major adverse cardiovascular event free proportion stratified by achievement of predicted METs and transplantation status.

Graph demonstrates cumulative MACE free proportion stratified by achievement of predicted METs and transplantation status at 7 years. Transplantation was treated as a time‐dependent variable and curves reflect univariable modeling. MACE indicates major adverse cardiovascular event; and METs, metabolic equivalents.
