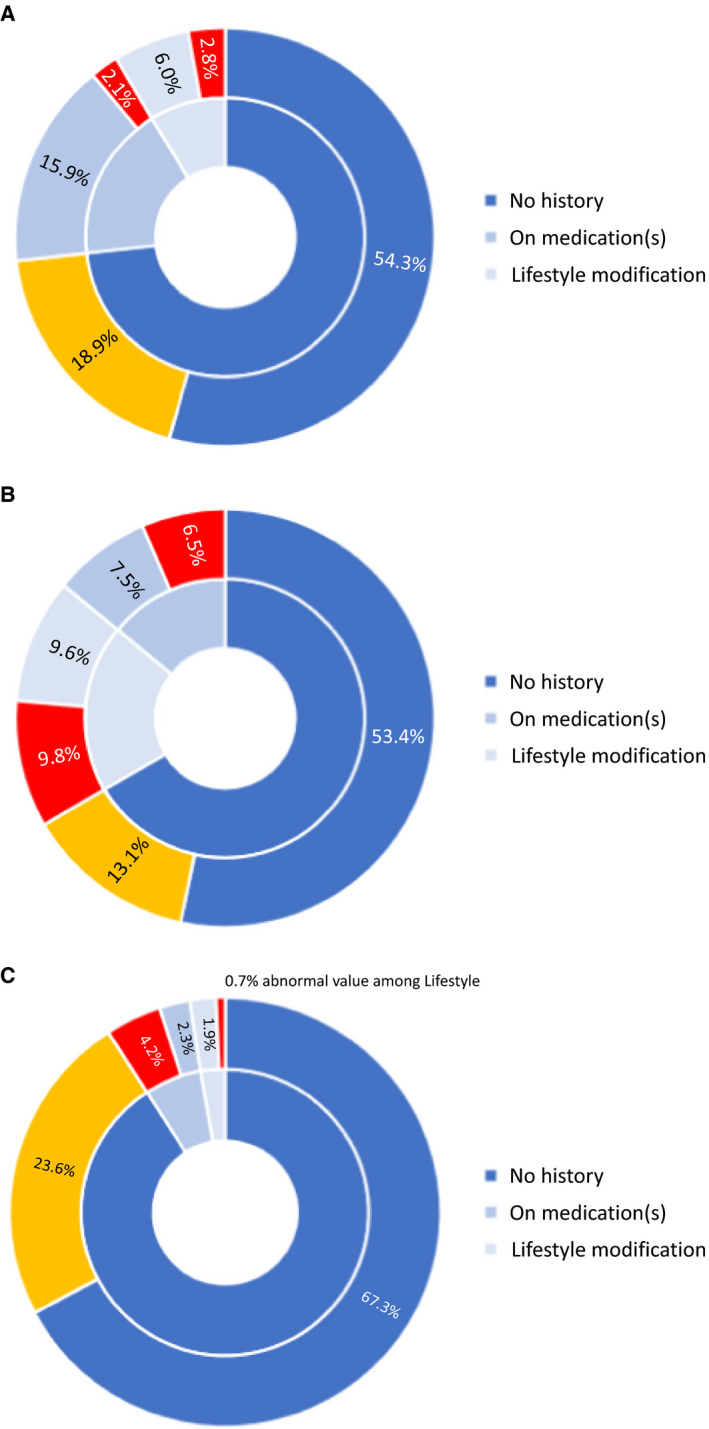
Figure 2. Sunburst charts showing the distribution of childhood cancer survivors (n=571) with normal and abnormal measurements corresponding to potential (A) hypertension, (B) dyslipidemia, and (C) glucose intolerance (diabetes and prediabetes).

The inner rings correspond to the proportions of survivors who reported no known history of the target cardiovascular risk factor (dark blue), survivors currently on medications (medium blue), and survivors with known risk factor but managed on lifestyle modification alone (light blue). The outer rings denote the proportion of survivors with a potentially underdiagnosed (gold) and undertreated (red) risk factor based on study measurements.
