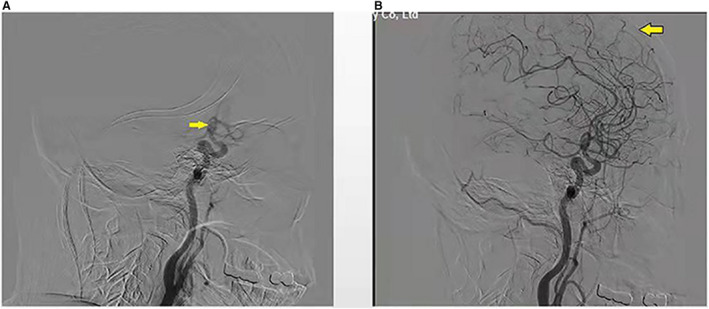
Figure 1. Schematic diagram of the measurement of cerebral circulation time (CCT).

(A) Appearance of the siphon segment of internal carotid (yellow arrow); (B) end of the arterial phase (yellow arrow). The CCT was defined as the time from the appearance of the siphon segment of internal carotid (yellow arrow) to the end of the arterial phase during digital subtraction angiography.
