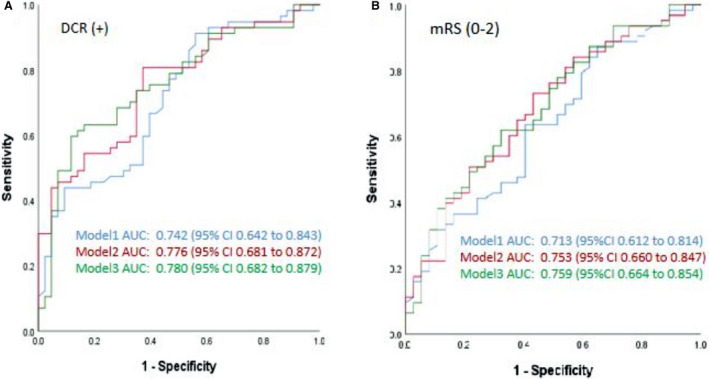
Figure 4. Receiver operating characteristic curve analysis of different cerebral circulation time (CCT) models for predicting DCR (A) and good outcome (B).

Model 1 adjusted by admission NIHSS, number of passes, collateral score, ICH, and final mTICI. Model 2 adjusted by admission NIHSS, number of passes, collateral score, ICH, final mTICI, and sCCT. Model 3 adjusted by admission NIHSS, number of passes, collateral score, ICH, final mTICI, and cCCT. AUC indicates area under the curve; cCCT, the change of sCCT versus hCCT; CCT, cerebral circulation time; DCR, dramatic clinical recovery; hCCT, CCT of the healthy side; ICH, intracranial hemorrhage; mRS, modified Rankin Scale; mTICI, modified Thrombolysis in Cerebral Infarction; NIHSS, National Institutes of Health Stroke Scale; and sCCT, CCT of the stroke side.
