
Figure 3. Dose‐response relationship between changes in blood pressure and combined docosahexaenoic acid (DHA)+eicosapentaenoic acid (EPA) intake of the studies stratified by the baseline systolic blood pressure (SBP) level.
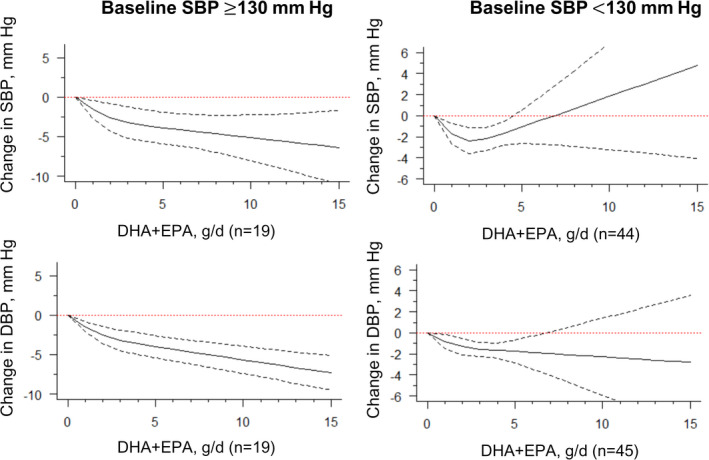
Marginal average dose‐response curve (solid line) with 95% point‐wise CIs (dashed lines) estimated by a 1‐stage random‐effects restricted cubic spline model, using 0 g/d as the referent, in participants with baseline SBP ≥130 mm Hg or <130 mm Hg. DBP indicates diastolic blood pressure; and n, number of the included study.