
Figure 2. Comparison of propensity score–matched cohorts.
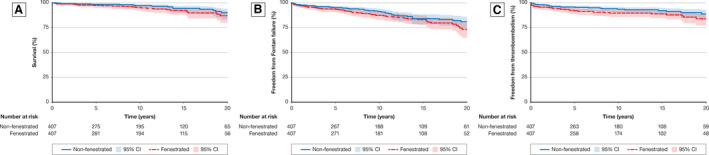
A, Survival in propensity score–matched cohorts. Log‐rank analysis of the propensity score–matched cohorts showed no difference in survival (P=0.16). The lack of difference demonstrates the influence of preoperative risk factors and the lack of impact of the fenestration on long‐term survival. B, Freedom from Fontan failure in propensity score–matched cohorts. Log‐rank analysis of the propensity score–matched cohorts showed no difference in freedom from Fontan failure (P=0.10). Similarly, the lack of difference demonstrates the influence of preoperative risk factors and the lack of impact of the fenestration on long‐term survival. C, Freedom from thromboembolic events in propensity score–matched cohorts. Log‐rank analysis of the propensity score–matched cohorts showed a higher incidence of thromboembolic events in the fenestrated group (P=0.03). Given this difference persists after propensity‐score matching, it demonstrates an association between fenestration and long‐term thromboembolic events that cannot be attributed to the cohort demographics.