
Figure 1. Rates of second events by type of first nonfatal event.
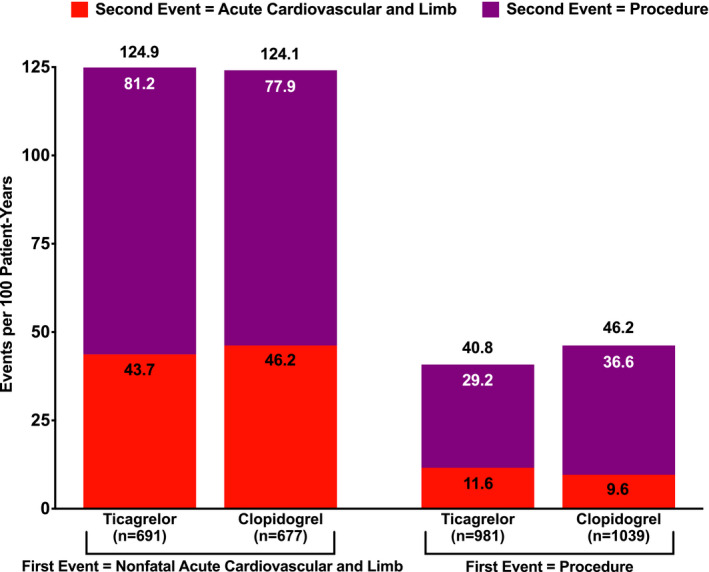
Values above bars are the sum of the rates of acute cardiovascular and limb events and procedures as a second event. Values within bars are the rates of acute cardiovascular and limb events or the rates of procedures as a second event.