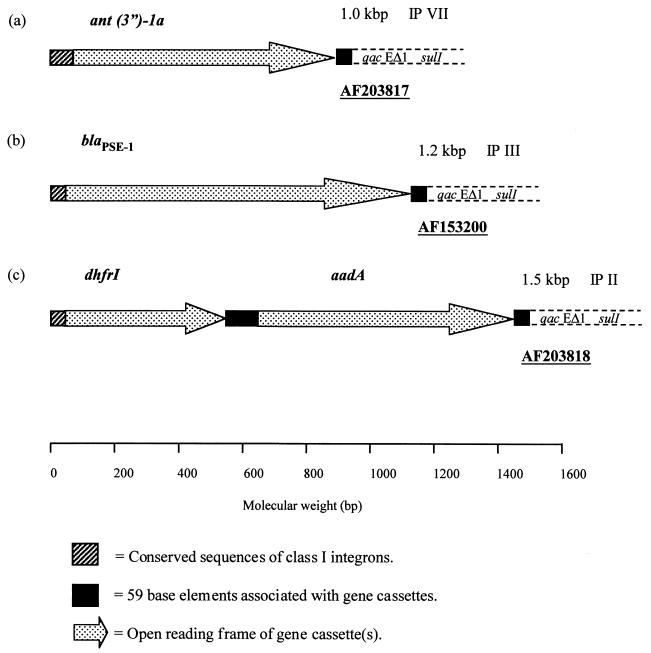
FIG. 2.
Schematic representation of the molecular organization of antimicrobial agent resistance-encoding ORFs sequenced from selected gene cassettes (see Fig. 1A). The direction of transcription is given by the arrowheads in the figure. Also included are the identities of each ORF, the corresponding GenBank accession numbers, the IP profile types, and the sizes of the amplified gene cassettes. Conserved integron-associated features are also shown. An approximate molecular weight scale is included at the bottom of the figure.

