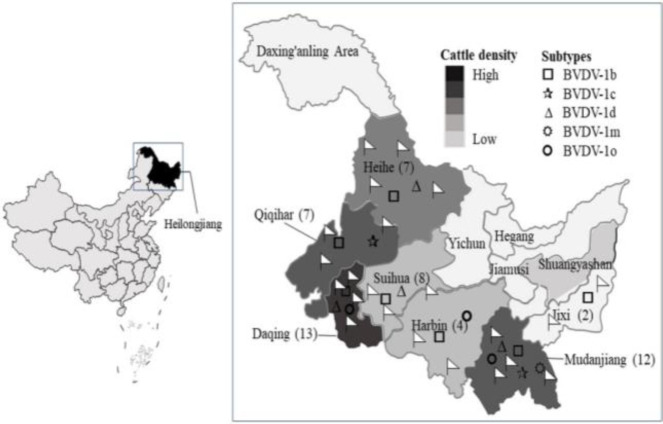
Fig. 1.
Spatial distribution of sampled farms and BVDV subtypes. The numbers in the brackets represent the number of BVDV isolates collected from seven districts of Heilongjiang province, China. The symbols represent different BVDV subtypes. The triangle flags represent the spatial distribution of the sampled farms

