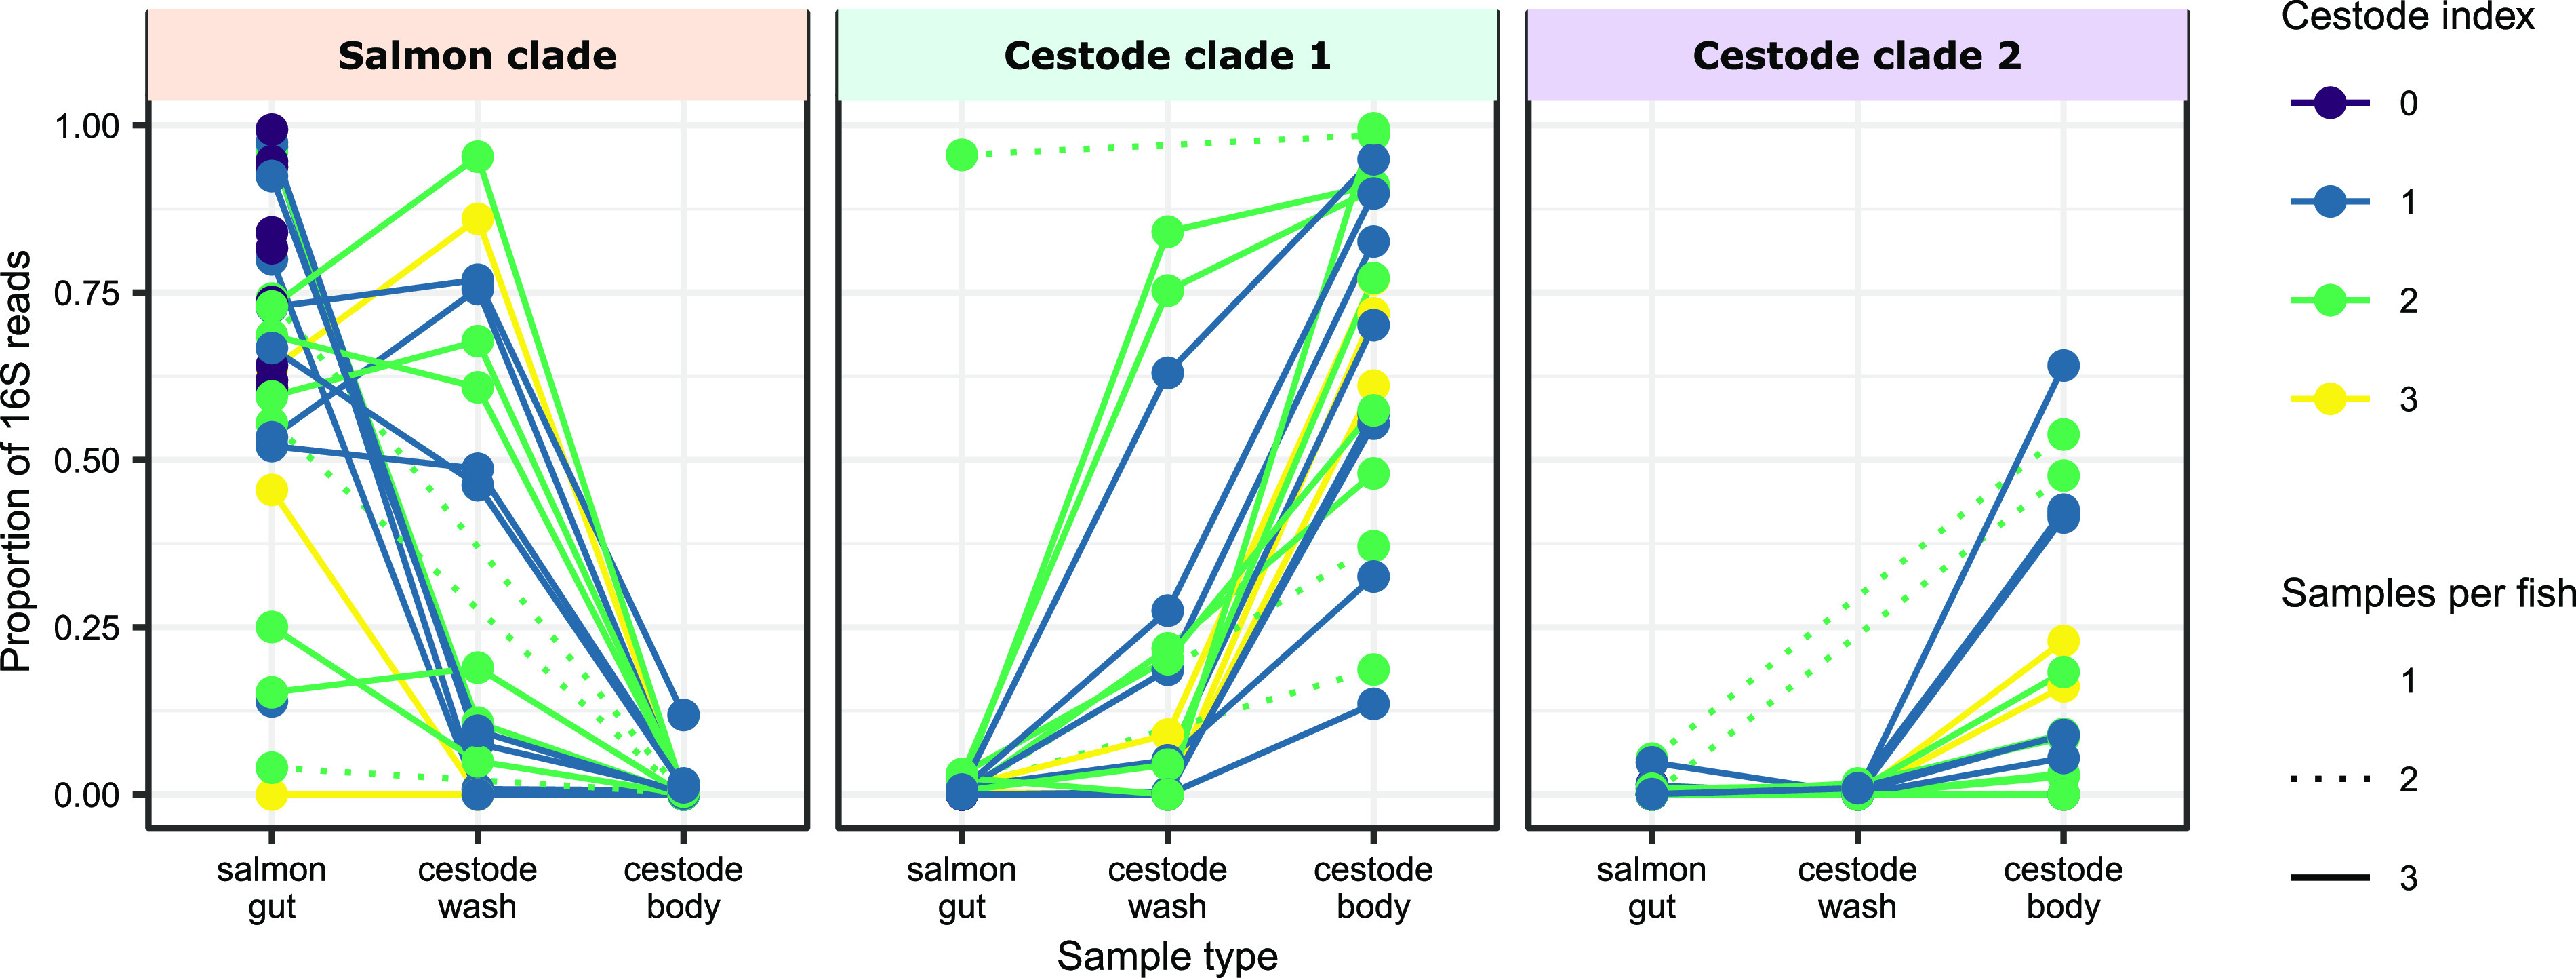
FIG 3.

Change in relative abundance of the three Mycoplasma clades (as indicated on the phylogenetic tree in Fig. 2) between each sample type. Solid lines connect each of the 3 samples taken from each individual. Dashed lines indicate individuals where one of the two cestode samples was missing. Individuals are colored by cestode index.
