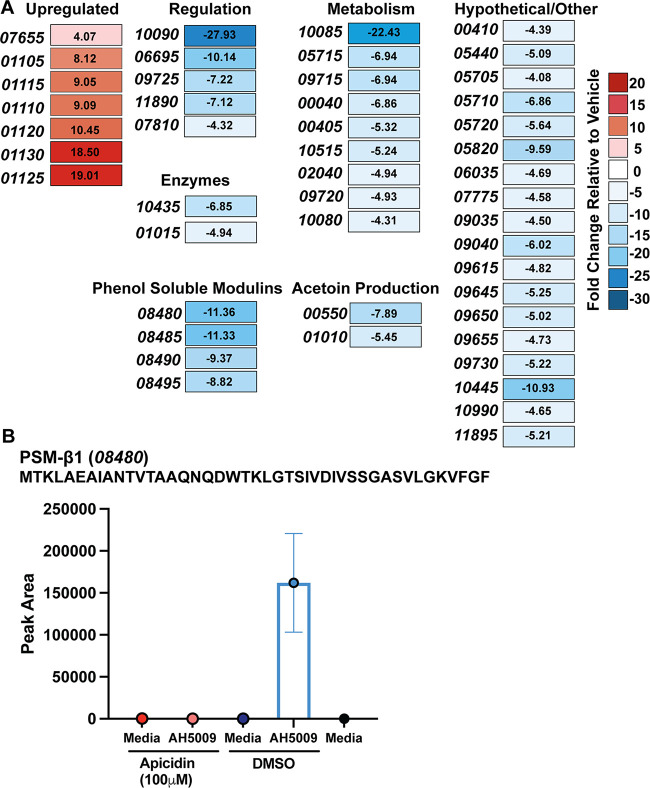
FIG 9.
Genes under transcriptional control of S. hominis AgrA. (A) RNA-seq heat map of genes with greater than a 4-fold change in expression and a false discovery rate P value of less than 0.05 in 100 μM apicidin-treated S. hominis compared to wild-type vehicle (DMSO)-treated cells. Fold changes are indicated in each box. Numbers in italics refer to the last five digits of the locus tag. (B) Mass spectrometric validation of the absence of PSM-β1 production in S. hominis treated with 100 μM apicidin. Results are averages from triplicate injections of biological triplicates (9 independent injections). The PSM-β1 predicted sequence and locus tag number are shown above the graph. The ion detected was at m/z 908.6785, which corresponds to the predicted mass (908.6819 Δm = 3.7 ppm) of PSM-β1with five protons and a +5 charge ([M + 5H]5+).

