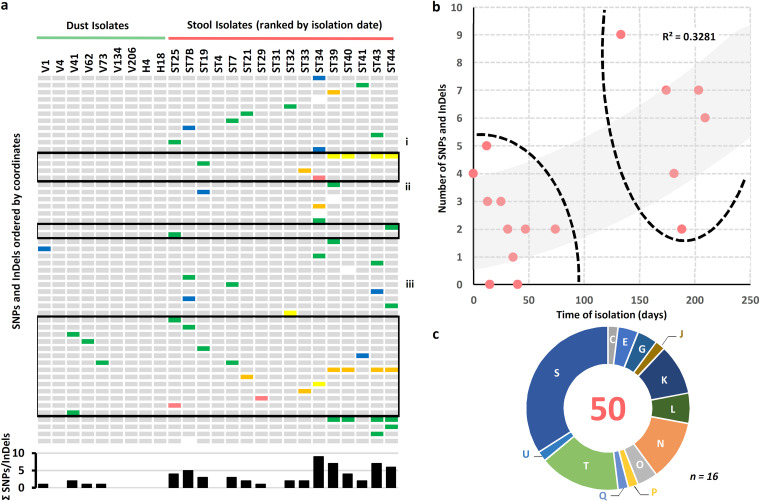
FIG 4.
Spatial, temporal, and functional distribution of SNPs identified in isolates. (a) Heat map showing the SNPs and InDels reported for each strain. Isolates are ordered according to their isolation origin and date. White, silent mutation; blue, intergenic region; purple, sense mutation located in rRNA; green, missense mutation; orange, frameshift deletion; yellow, frameshift insertion; red, nonsense mutation. The histogram shows the total of SNPs and Indels per isolate. (b) Number of SNPs and InDels reported for each stool isolate according to the time (in days) from the isolation of the first Clostridium botulinum isolate. The two distinct clusters of stool samples are highlighted by dashed lines. The trendline (gray) and its corresponding R2 value are also indicated. (c) Repartition of the SNPs and InDels in stool isolates per clusters of orthologous groups of proteins (COGs) as determined using eggNOG v5.0 (71). The central number corresponds to the total count of mutated coordinates. The letter identification system describes the different COGs, as previously defined (72). n, number of stool isolates.

