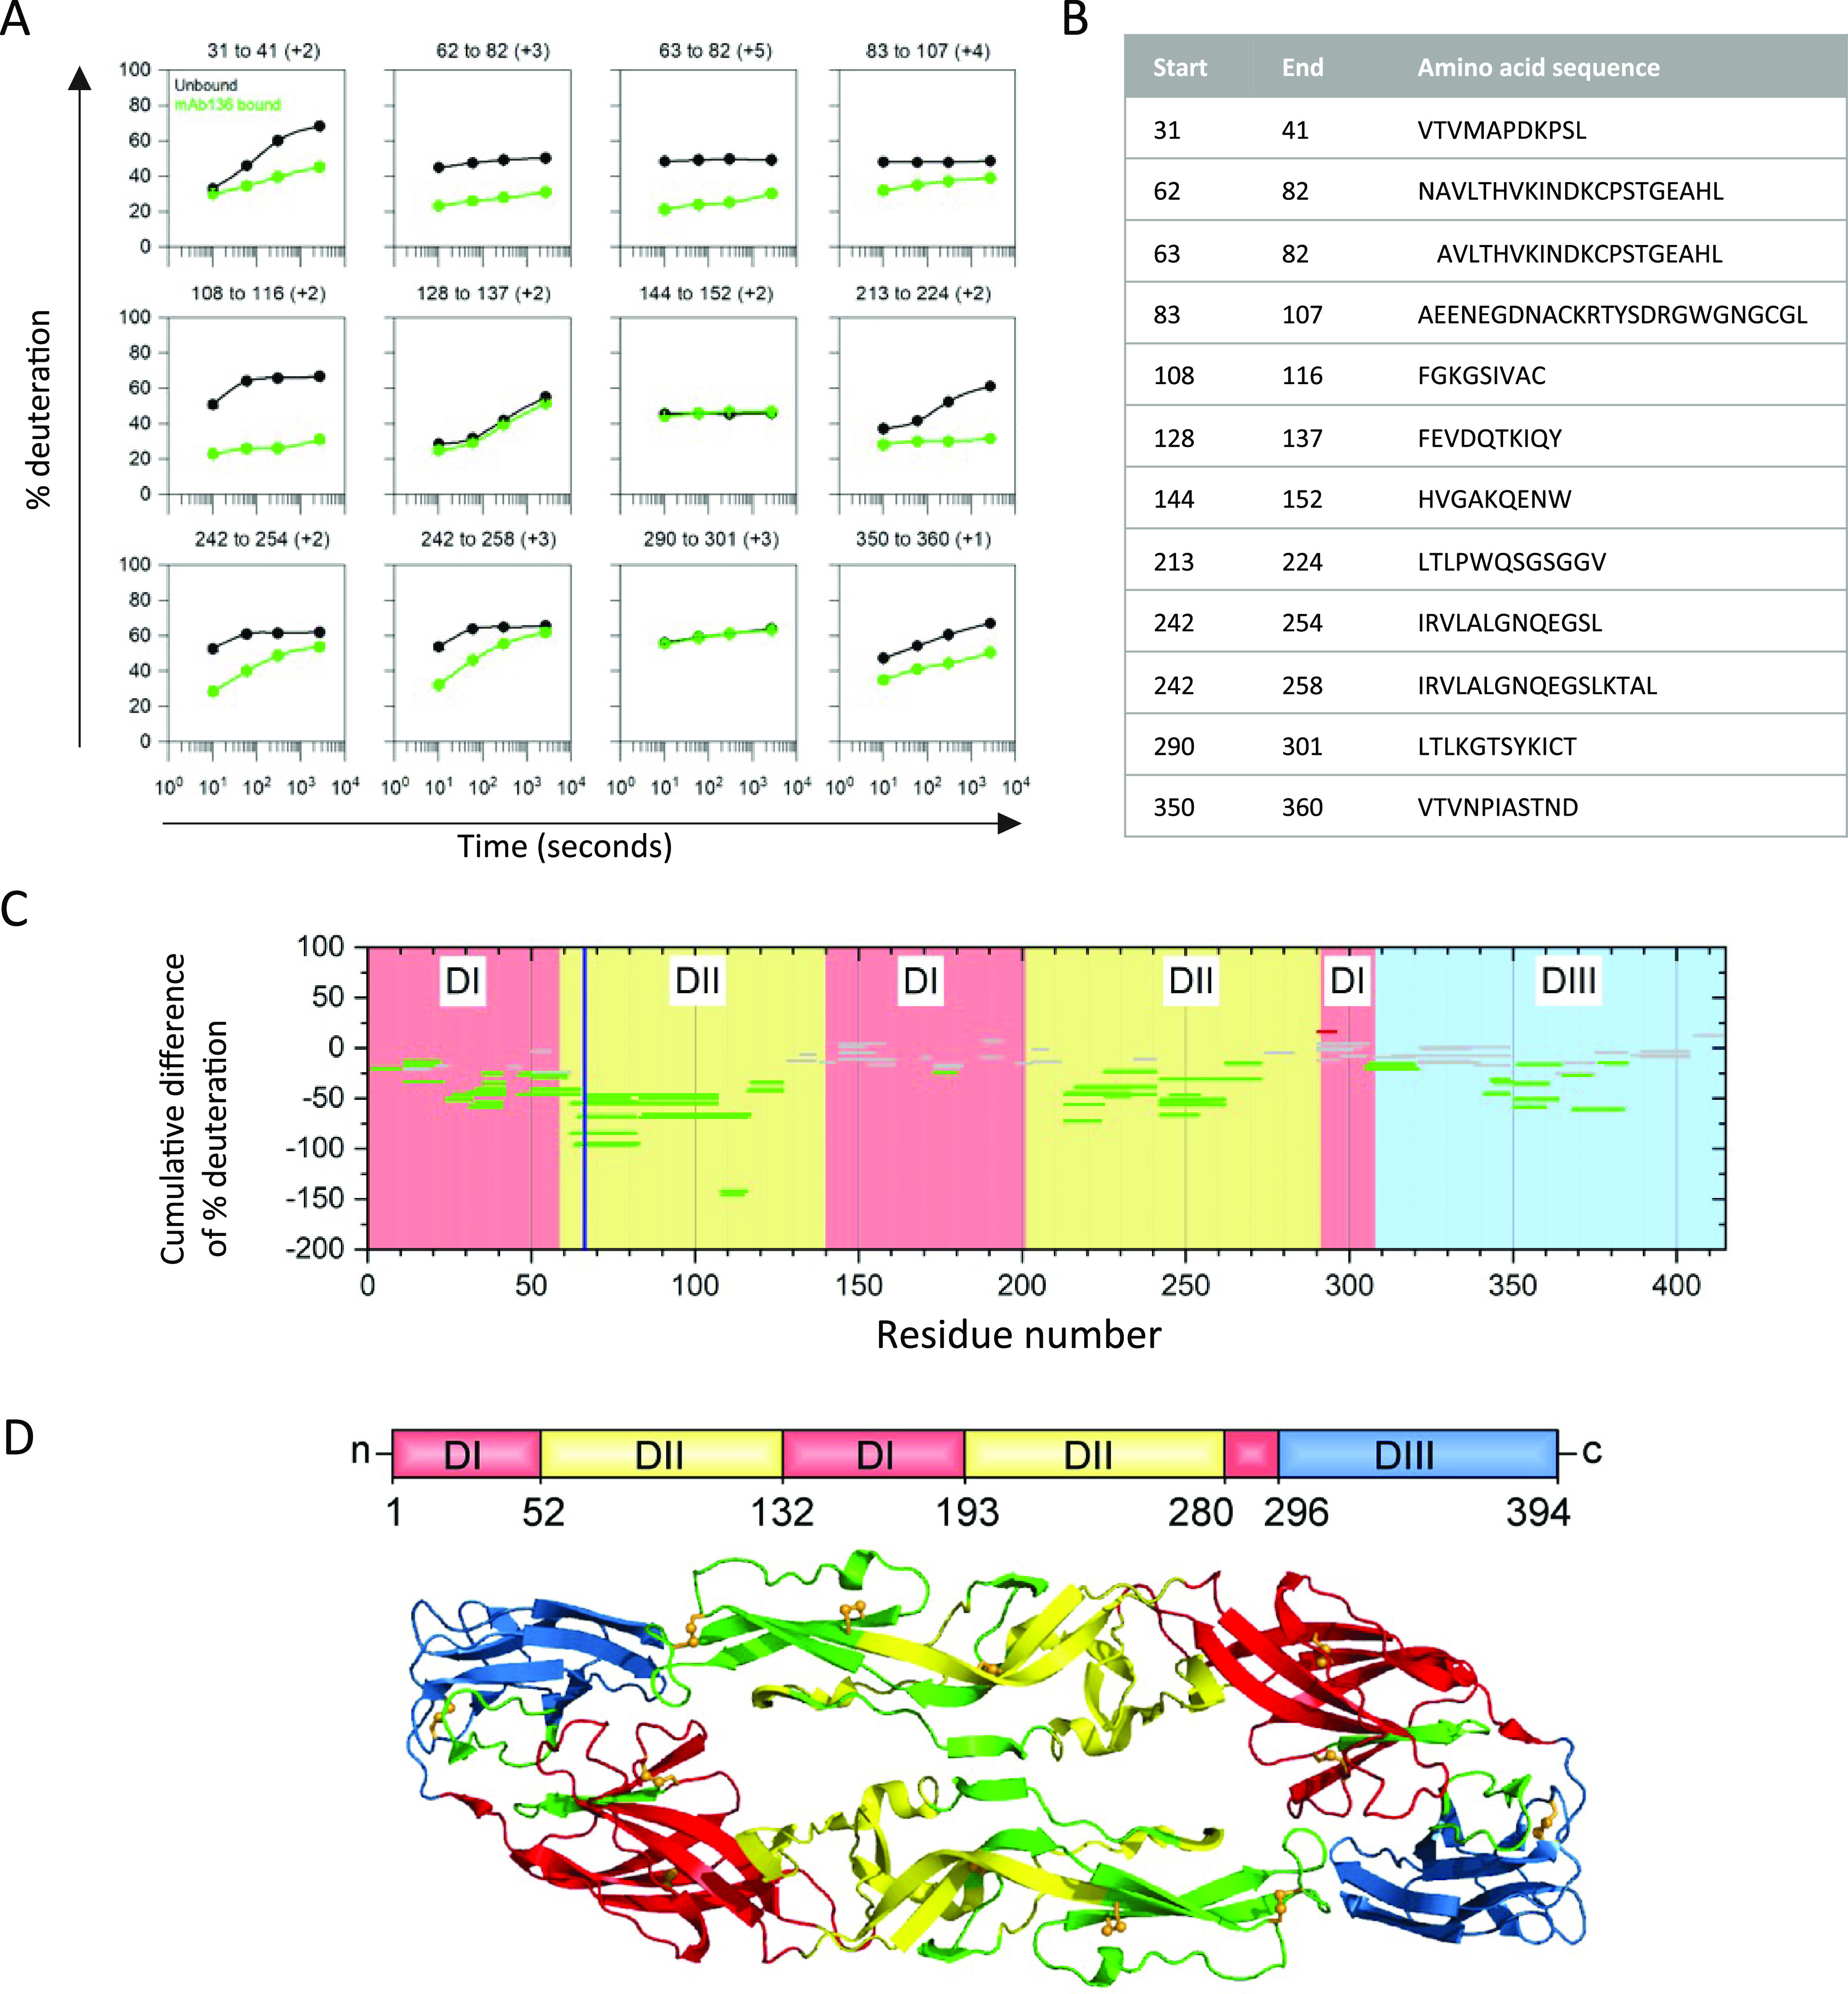
FIG 3.

Epitope mapping for Fab YFV-136 by HDX-MS. (A) Representative kinetic plots for the 12 different peptides showing the effects of Fab binding by HDX. Black or green lines are for YFV E protein in the absence or presence of the mAb YFV-136, respectively. At the top of each panel are the residue numbers and charge states of the peptide. (B) Sequences and positions of each peptide. (C) Woods plots showing accumulated differences in percent deuteration (bound state − unbound state) across all time points for each analyzed peptide. The propagated error for the cumulative difference was calculated for each peptide, and 99% confidence intervals were calculated. Peptides whose differential exchange exceeds the 99% confidence interval are considered to show significant differences between the bound and unbound states and to be involved in binding. Peptides that do not show any significant differences between the bound and unbound states are in gray, whereas protected peptides are in green. The blue vertical line shows the location of the H67Y escape mutation identified in the studies shown in Fig. 4. (D) Protected peptides are shown in green on a ribbon representation of the YFV E dimer. The domains are indicated in red (DI), yellow (DII), and blue (DIII).
