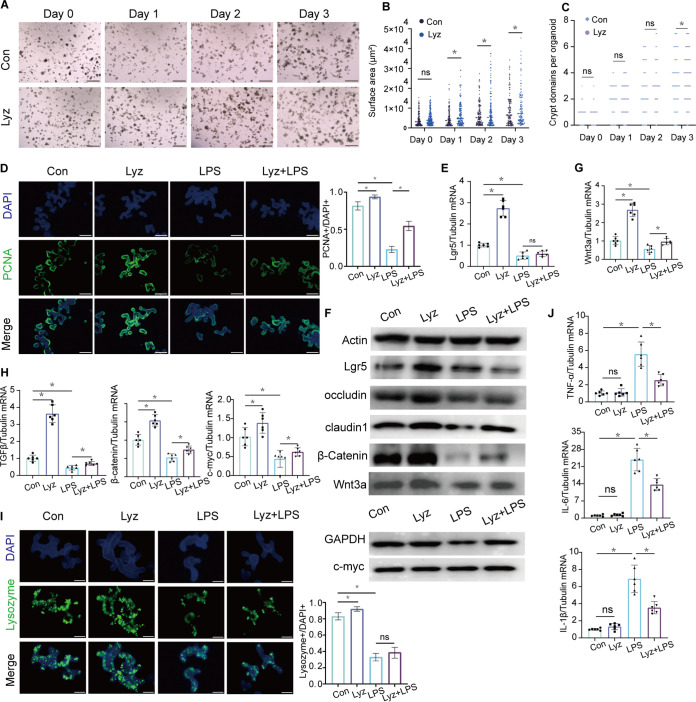
FIG 10.
Lysozyme promoted enteroid proliferation. (A) Light microscopy photographs showing normal morphology and sizes of enteroids in the Lyz group compared to the Con group. (B) The mean surface area of enteroids was estimated 1 day, 2 days, and 3 days after incubation with lysozyme. (C) Crypt domains per enteroid were counted. (D) Representative images of fluorescence staining of PCNA (green) of enteroids after incubation with lysozyme and LPS. The expression of PCNA was quantified. (E) mRNA expression of Lgr5. (F) Image of Western blotting and protein quantification of Lgr5, occludin, claudin1, β-catenin, Wnt3a, and c-myc. GAPDH, glyceraldehyde-3-phosphate dehydrogenase. (G and H) mRNA expression levels of Wnt3a (G) and TGFβ, β-catenin, and c-myc (H). (I) Representative images of fluorescence staining of lysozyme (green) of enteroids. The expression of lysozyme was quantified. (J) mRNA expression levels of TNF-α, IL-6, and IL-1β of enteroids after incubation with lysozyme and LPS. The data are presented as the means ± SD. ns, no significant difference; *, P ≤ 0.05.

