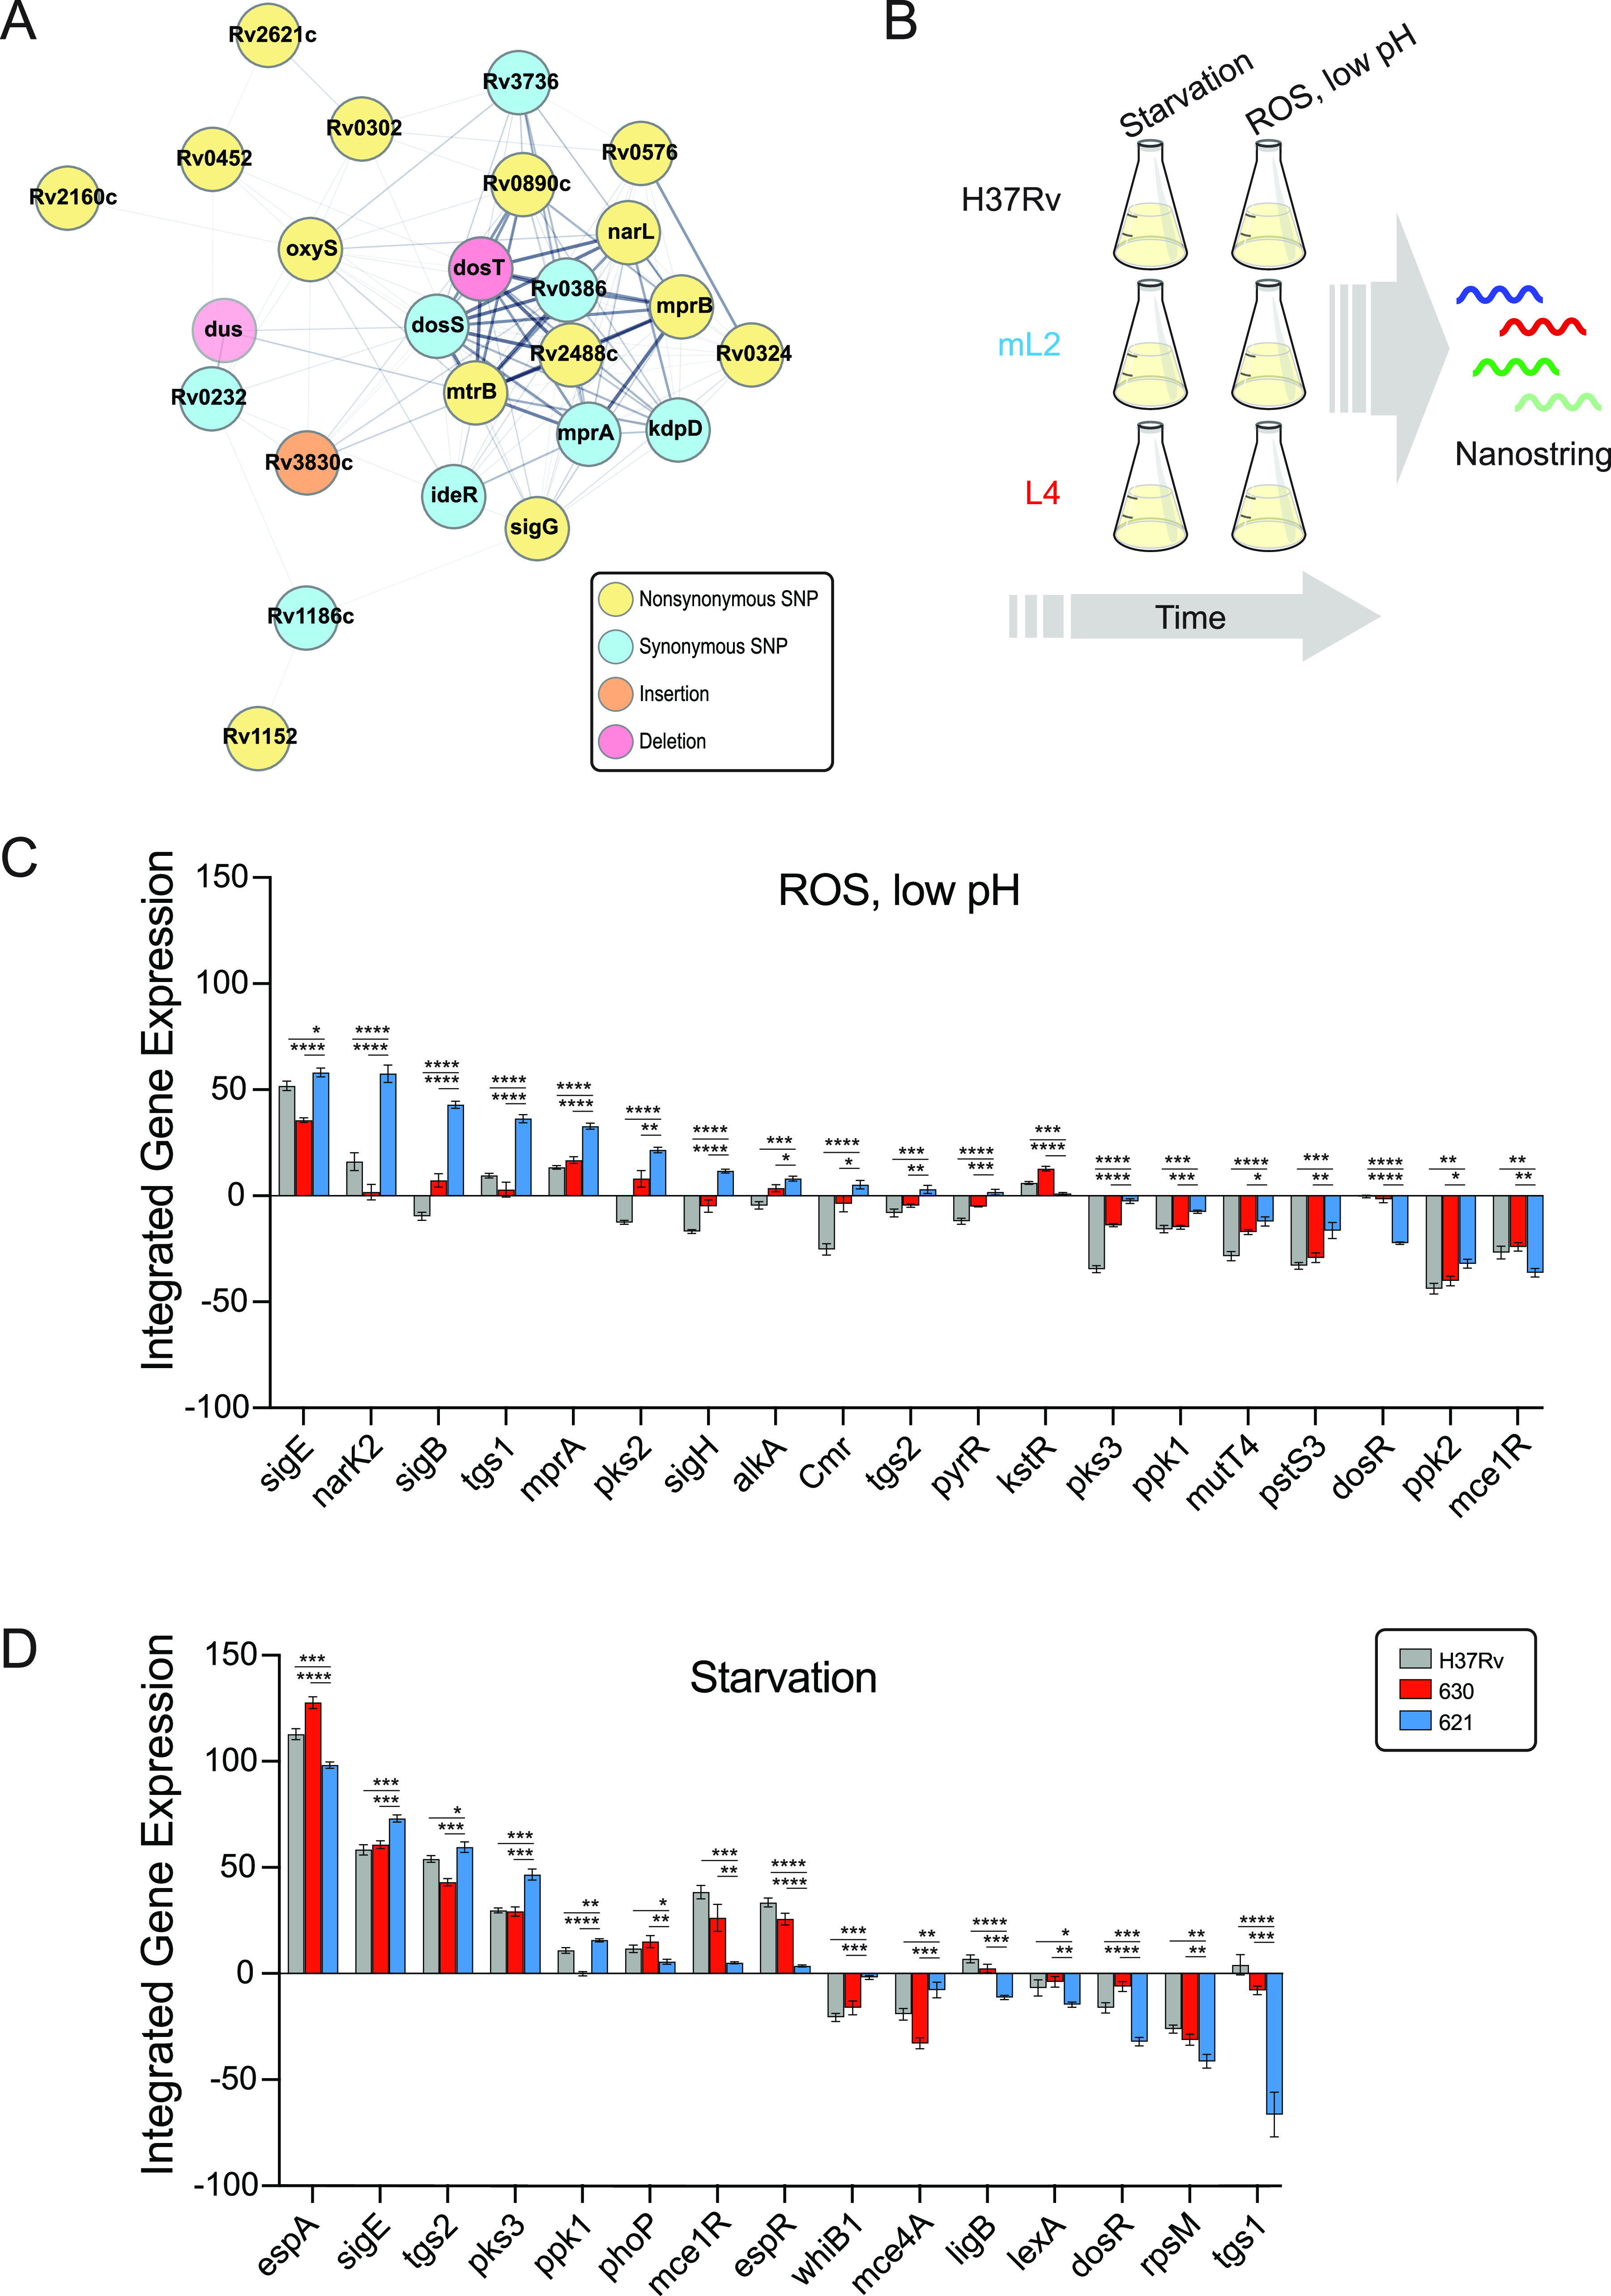
FIG 3.

Transcriptional signatures under stress conditions differ between M. tuberculosis strains. (A) STRING plot of regulatory genes with coding region variants specifically in the mL2 strain 621 compared to the L4 strain 630 and the reference strain H37Rv. Edge thickness represents strength of evidence for direct interaction. (B) Experimental strategy for the in vitro stress gene expression experiment. (C and D) Genes with quantitative and qualitative differences in expression in the mL2 strain under oxidative stress, low-pH conditions (C), and starvation conditions (D) over the course of the experiment. Asterisks indicate significant differences in integrated gene expression over time, determined by calculating the area under the curve for T0 normalized, log2 transformed data and performing one-way ANOVA with Tukey’s posttest for significance.
