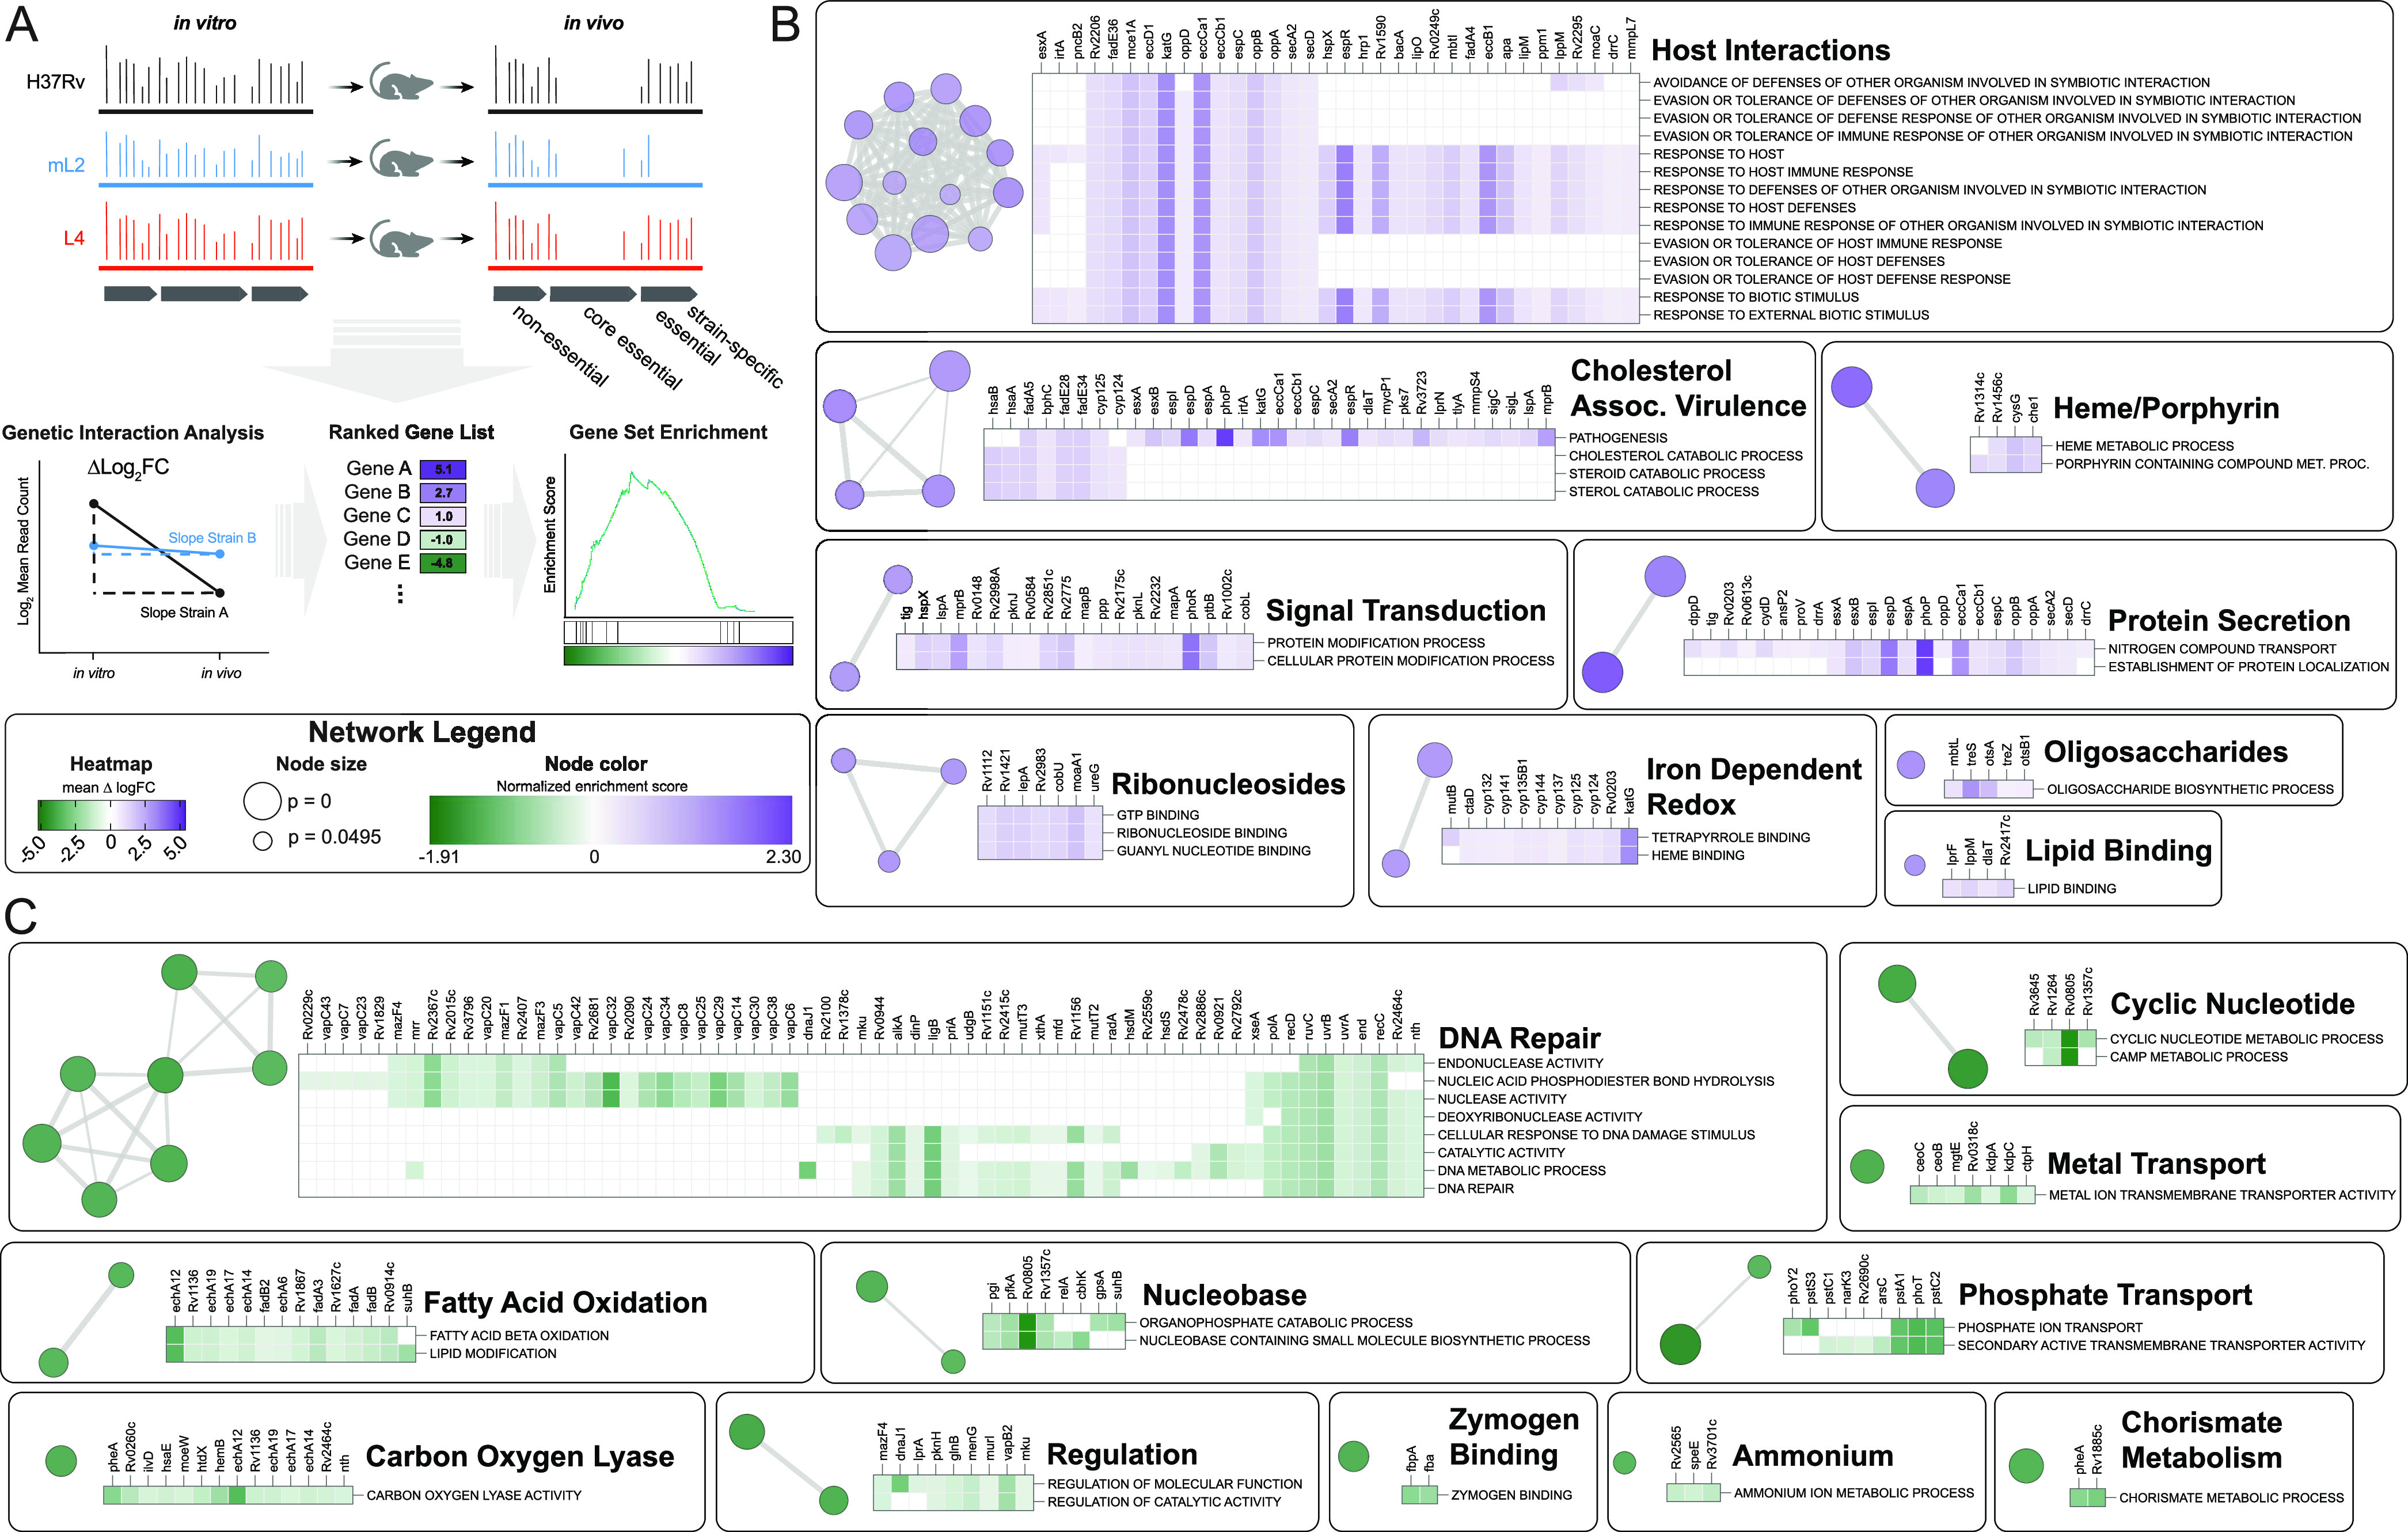
FIG 4.

Functional genomics to identify genetic determinants of mL2 infection phenotypes. (A) Experimental strategy and analytic approach to defining differences in relative genetic requirements between strains during infection using transposon sequencing and genetic interactions analysis. (B and C) Network plots generated in Cytoscape depicting genes that have a decreased requirement (B) in the mL2 strain compared to the reference strain, H37Rv, 1 week postinfection or an increased requirement (C) by GSEA. Nodes represent enriched Gene Ontology (GO) terms with a cutoff of P < 0.05. GO terms that were also significant in the comparison between H37Rv and the L4 clinical isolate 630 were excluded. Node color represents normalized enrichment score. Node size is inversely proportional to significance value. Edge thickness represents the number of overlapping genes, determined by the similarity coefficient. Heatmaps display leading edge genes for each cluster, with color corresponding to the Δlog2(fold change) values of the genetic interactions TnSeq analysis.
