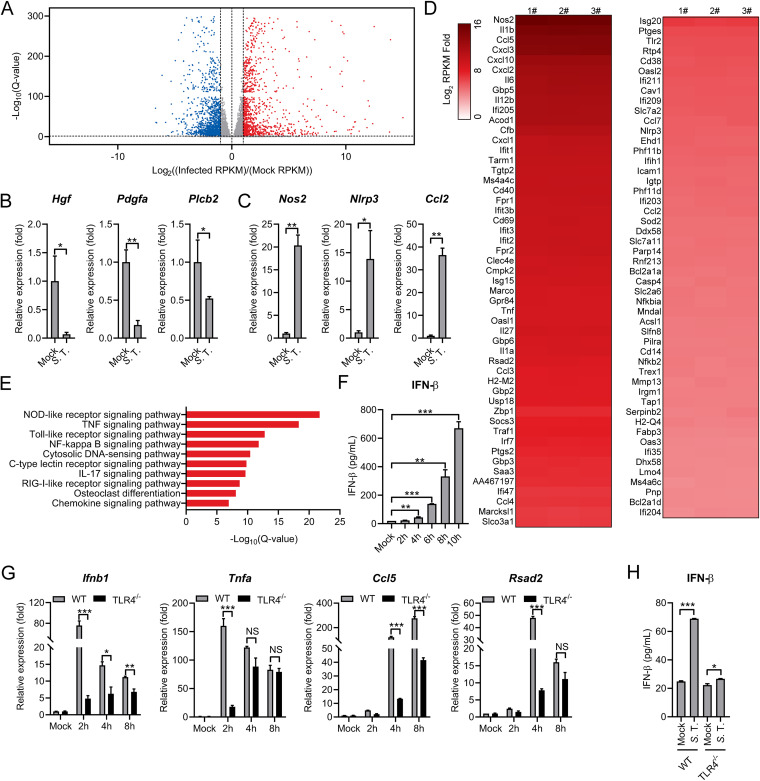
FIG 2.
RNA-seq analysis reveals the induction of type I IFN response in S. Typhimurium-infected murine macrophages. (A) Volcano plot showing gene expression analysis of PMs uninfected (mock) or infected with S. Typhimurium for 8 h at an MOI of 10. The x-axis shows a fold change in gene expression by calculating log2(infected RPKM/mock RPKM) and the y-axis shows statistical significance (log10[Q-value]). Downregulated genes are plotted on the left (blue) and upregulated genes are on the right (red). Each treatment had 3 biological replicates. RPKM: reads per kilobase of exon model per Million mapped reads. Differentially expressed genes were those with a false discovery rate (FDR) cutoff of 0.05 and a fold change of ≥±2. (B and C) qRT-PCR analysis of gene expression of downregulated genes (B) and upregulated (C) genes in mouse PMs uninfected (mock) or infected with S. Typhimurium for 8 h at an MOI of 10 (n = 3). (D) Heatmap of RNA-seq analysis. PMs were uninfected (mock) or infected with S. Typhimurium for 8 h at an MOI of 10. Heatmap was made by calculating log2(infected RPKM/mock RPKM). Numbers 1, 2, and 3 indicate 3 biological replicates. (E) Ingenuity pathway analysis of upregulated gene expression changes in PMs infected with S. Typhimurium. (F) ELISA analysis of IFN-β production in mouse PMs uninfected (mock) or infected with S. Typhimurium for 2, 4, 6, 8, or 10 h at an MOI of 10 (n = 3). (G) qRT-PCR analysis of gene expression in C57BL/6 (WT) or TLR4−/− mouse-derived PMs uninfected (mock) or infected with S. Typhimurium for 2, 4, and 8 h at an MOI of 10 (n = 3). (H) ELISA analysis of IFN-β production in the supernatant from C57BL/6 (WT) or TLR4−/− mouse-derived PMs uninfected (mock) or infected with S. Typhimurium for 6 h at an MOI of 10 (n = 3). Data in (B) and (C) were normalized to uninfected control (mock, set as 1), Data in (G) were normalized to mock-infected C57BL/6 (WT) PMs, mock-infected TLR4−/− mouse-derived PMs, respectively (mock, both set as 1). Actin was used as the housekeeping gene. Error bars represent ± SEM. *, P < 0.05; **, P < 0.01; ***, P < 0.001.

