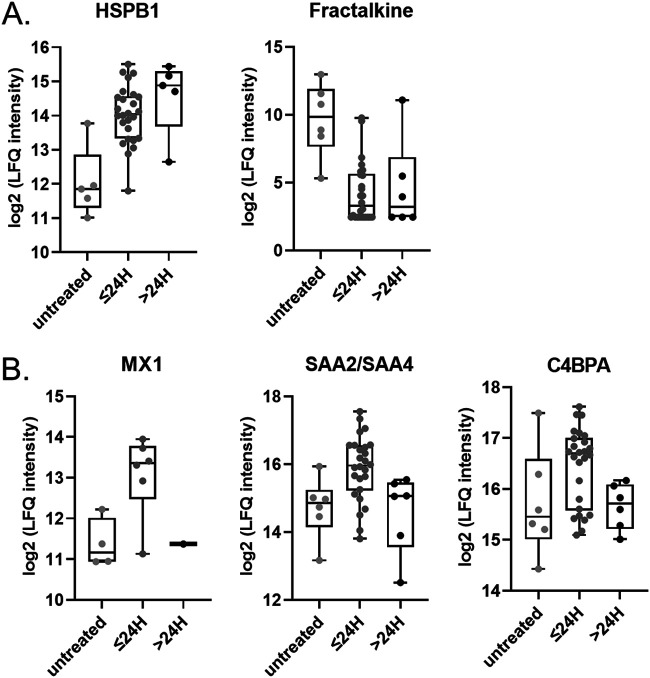
FIG 5.
IFN-regulated proteins. Shown are log2 expression levels for the indicated proteins in plasma from untreated patients and plasma collected and analyzed at ≤24 h and ≥24 h relative to IFN treatment. One-way ANOVA was performed. (A) HSPB1 (q value = 0.045) and fractalkine (q value = 0.045); (B) MX1 (q value = 0.27), SAA2/SAA4 (q value = 0.21), and C4BPA (q value = 0.33).

