FIG 5.
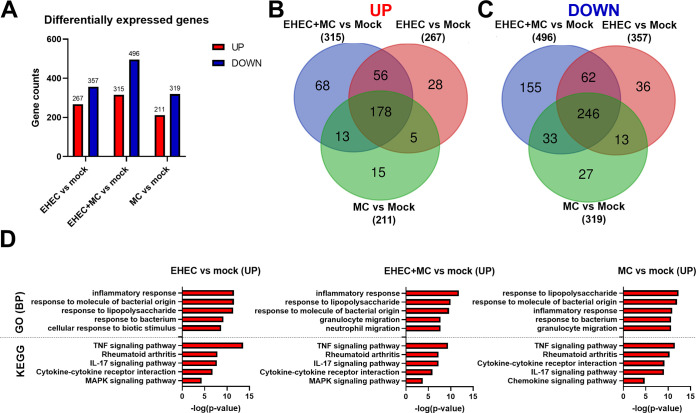
Colonic transcriptional response to infection with EHEC and commensal strains. Colonoid monolayers were infected for 6 h with EHEC, EHEC in the presence of commensals (EHEC+MC), or commensals only (MC), and transcriptomes were analyzed by RNA sequencing. (A) Total number of differentially expressed genes (DEGs) in infected colonoid monolayers versus mock controls. Red and blue indicate up- and downregulated genes, respectively. (B) Venn diagram showing the number of upregulated genes in each comparison (EHEC versus mock, EHEC+MC versus mock and MC versus mock). (C) Venn diagram showing the number of downregulated genes in each comparison. (D) Upregulated gene set enrichments showing the top 5 GO Biological Processes and KEGG pathways in infected colonoid monolayers over mock controls.

