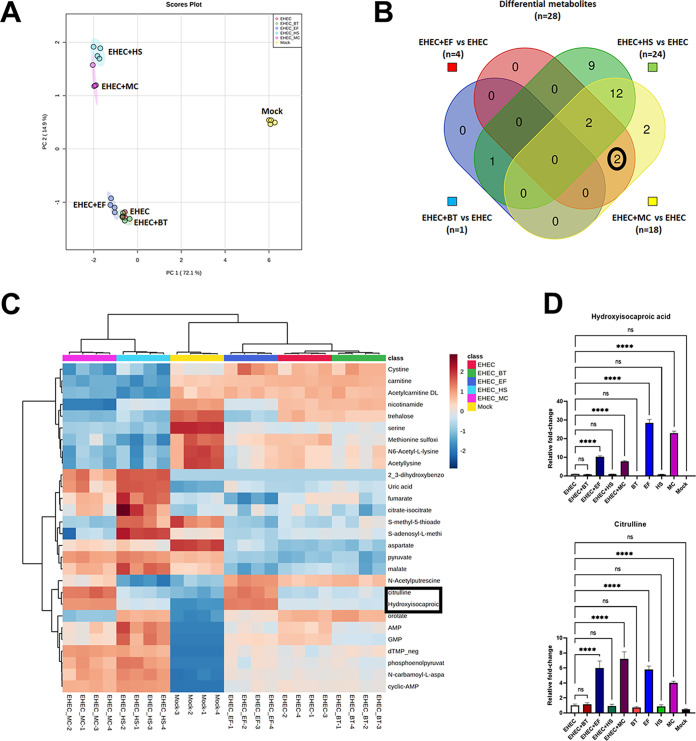
FIG 6.
Gut commensals change the metabolic landscape. Colonoid monolayers were infected with EHEC and commensal strains for 6 h, and metabolites in the extracellular media (exometabolome) were identified by LC-MS/MS. (A) Principal-component analysis (PCA) of the profiling data from the colonoid monolayers exometabolome, showing clear separation among the groups (infected and mock controls). (B) Venn diagram illustrating metabolites that were differentially abundant (fold change > 2.0, FDR < 0.05) in coinfections with commensal strains compared to colonoid monolayers infected with EHEC alone. (C) Heatmap of the 28 differential metabolites showed in the Venn diagram. Red and blue indicate higher and lower levels, respectively. (D) Relative abundance of hydroxyisocaproic acid and citrulline (highlighted in both the heatmap and the Venn diagram) in the exometabolome of mock and infected colonoid monolayers compared to results with EHEC alone. Statistical significance was determined by one-way ANOVA followed by a post hoc Tukey test. ****, P < 0.0001; ns, not significant.

