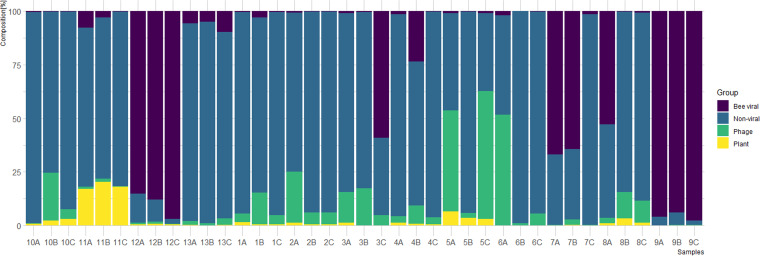
FIG 1.
Composition of sequencing reads in all 39 analyzed samples. Each hive was analyzed in 3 independent replicates consisting of nine individual bees. The percentages of reads of different taxonomic affiliations (plant viruses, bacteriophages, bee viruses, and nonviral) are denoted in different colors.

