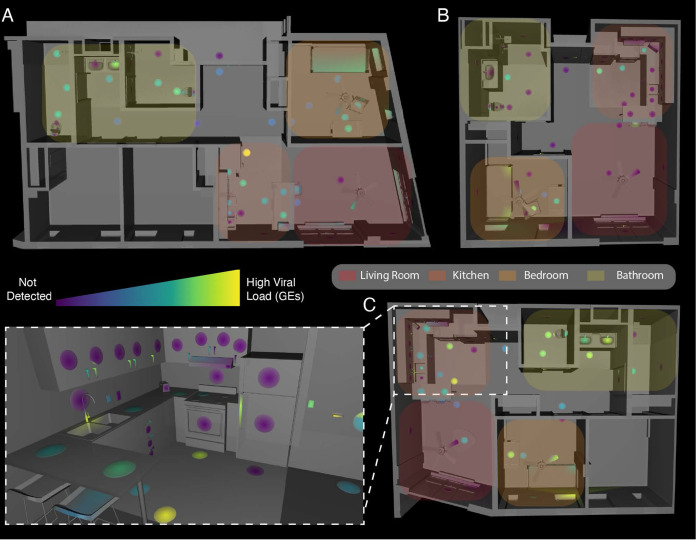
FIG 1.
Distribution of SARS-CoV-2 viral load in isolation dorm apartments. (A to C) Floor plans for each apartment highlighted where SARS-CoV-2 RNA signatures were detected. (Inset) 3D rendering of the kitchen in apartment C showing SARS-CoV-2 viral load in genomic equivalents (GEs) mapped to features in that room.

