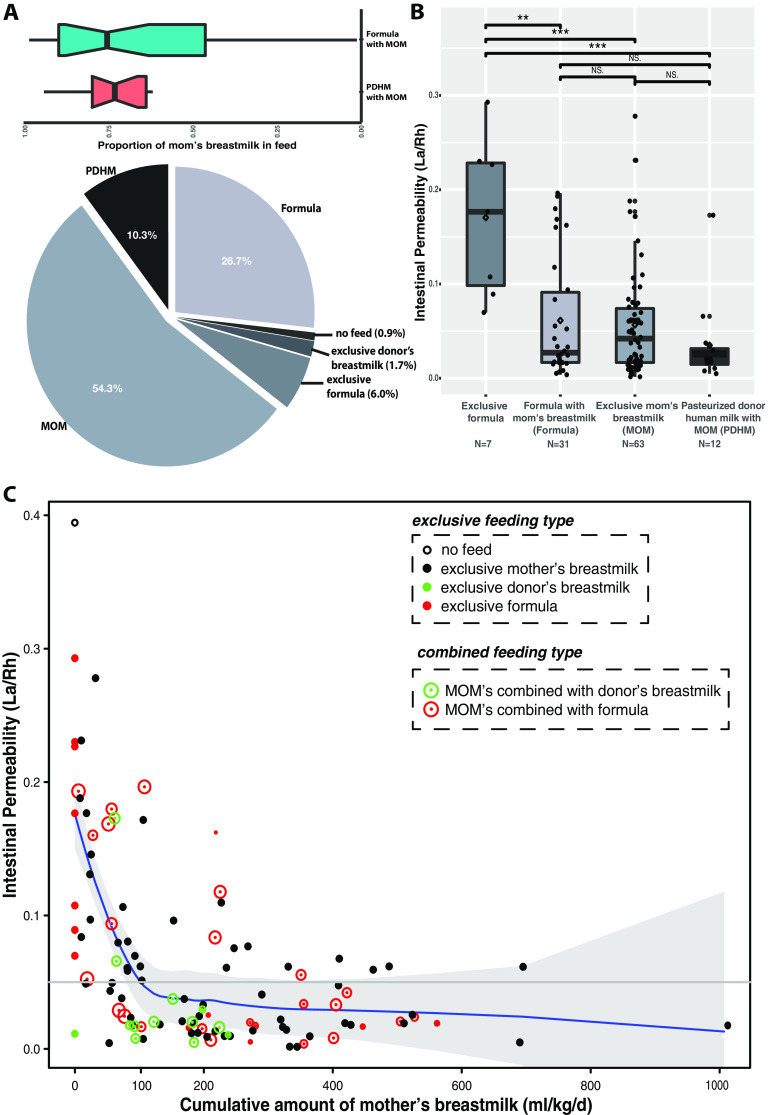
FIG 2.
(A) Pie chart of feeding types for the preterm infant population in this study. Abbreviations: MOM, mother’s own breastmilk; PHDM, pasteurized human donor’s milk. (B) Box plot of IP measurements grouped by feeding types. (C) Correlation between intestinal permeability and the cumulative amount of mother’s own breastmilk feeding (milliliters per kilogram) for a total of 113 enrolled preterm infants at 240/7 to 326/7 weeks of gestation. IP was calculated using the ratio of urine lactulose (La) to rhamnose (Rh), and low or high IP was defined by an La/Rh ratio of >0.05 or ≤0.05, respectively. The total amount of mother’s own breastmilk feeding was calculated as the sum of the daily amount of milk intake per kilogram of body weight until days 7 to 10, when IP was measured. Initial feeding was calculated based on 10 mL/kg expressed breastmilk between the first and fourth days of life depending on clinical stability. After 3 to 5 days of initial feeds, feedings were advanced by 20 mL/kg/day until 100 mL/kg/day was reached. Plotted are interquartile ranges (IQRs) (boxes), medians (lines in boxes), and means (diamonds). Significance values were calculated using a Wilcoxon rank sum test. * denotes the level of significance. NS, nonsignificant.

