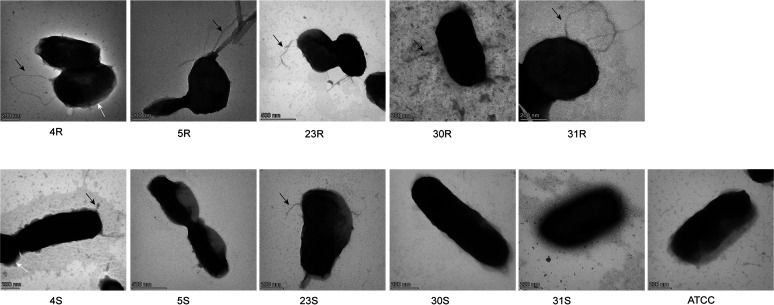
FIG 3.
Transmission electron micrographs of A. actinomycetemcomitans fimbriae visualized by negative staining. A. actinomycetemcomitans bacteria with the R and S phenotypes were grown in BHI broth for 40 h. The bacteria were then harvested by centrifugation, and the bacterial pellets were washed with PBS. After staining, the different A. actinomycetemcomitans bacteria were imaged by TEM. Magnification is indicated by size bars.

