
Figure 1.
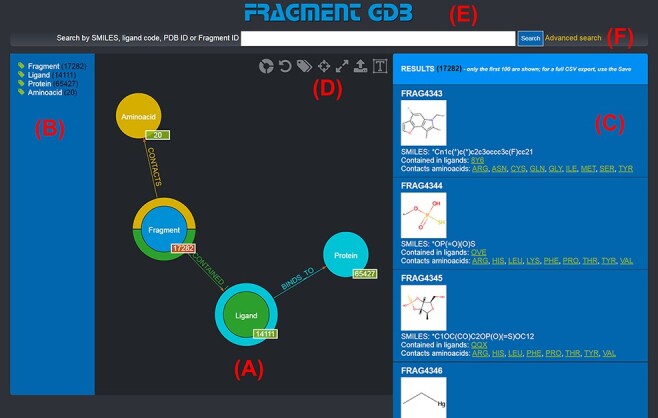
Landing page of the FGDB. (A) The main panel of the graph database, where the entities and their relationships are shown and which allows users to browse the data and perform graphical queries for filtering them out. (B) The left side taxonomical panel shows the types and number of entities stored in FGDB; it is immutable regardless of the queries performed and allows users to individually filter a specific type of entity to be visualized. (C) The right side panel shows a subset (up to 100) of the Fragments resulting from the currently executed query, displaying the number of the total results and providing, for each entity shown, its corresponding information in terms of identifier, molecular structure, SMILES, list of ligands where the Fragment is contained and list of amino acids contacted; the latter two are hyperlinked with the corresponding entry of the PDB. (D) Upper toolbar of the main panel, providing users with a number of useful functionalities, from left to right: hiding/showing clickable relationships around the entities (the colored crowns/half-crowns around the Fragment and Ligand nodes), resetting the graph to the last executed query, hiding/showing the left taxonomical panel, centering the graph, making the graph full-screen, exporting the current graph and enlarging/shrinking the size of the nodes’ textual labels. (E) The basic search field where users may search for Fragments by SMILES of the Fragment, ligand code of the contained ligands, PDB ID of the proteins the contained ligands bind to or Fragment identifier. (F) The hyperlink to the advanced search panel, where users may carry out more complex queries against the database.