Figure 3.

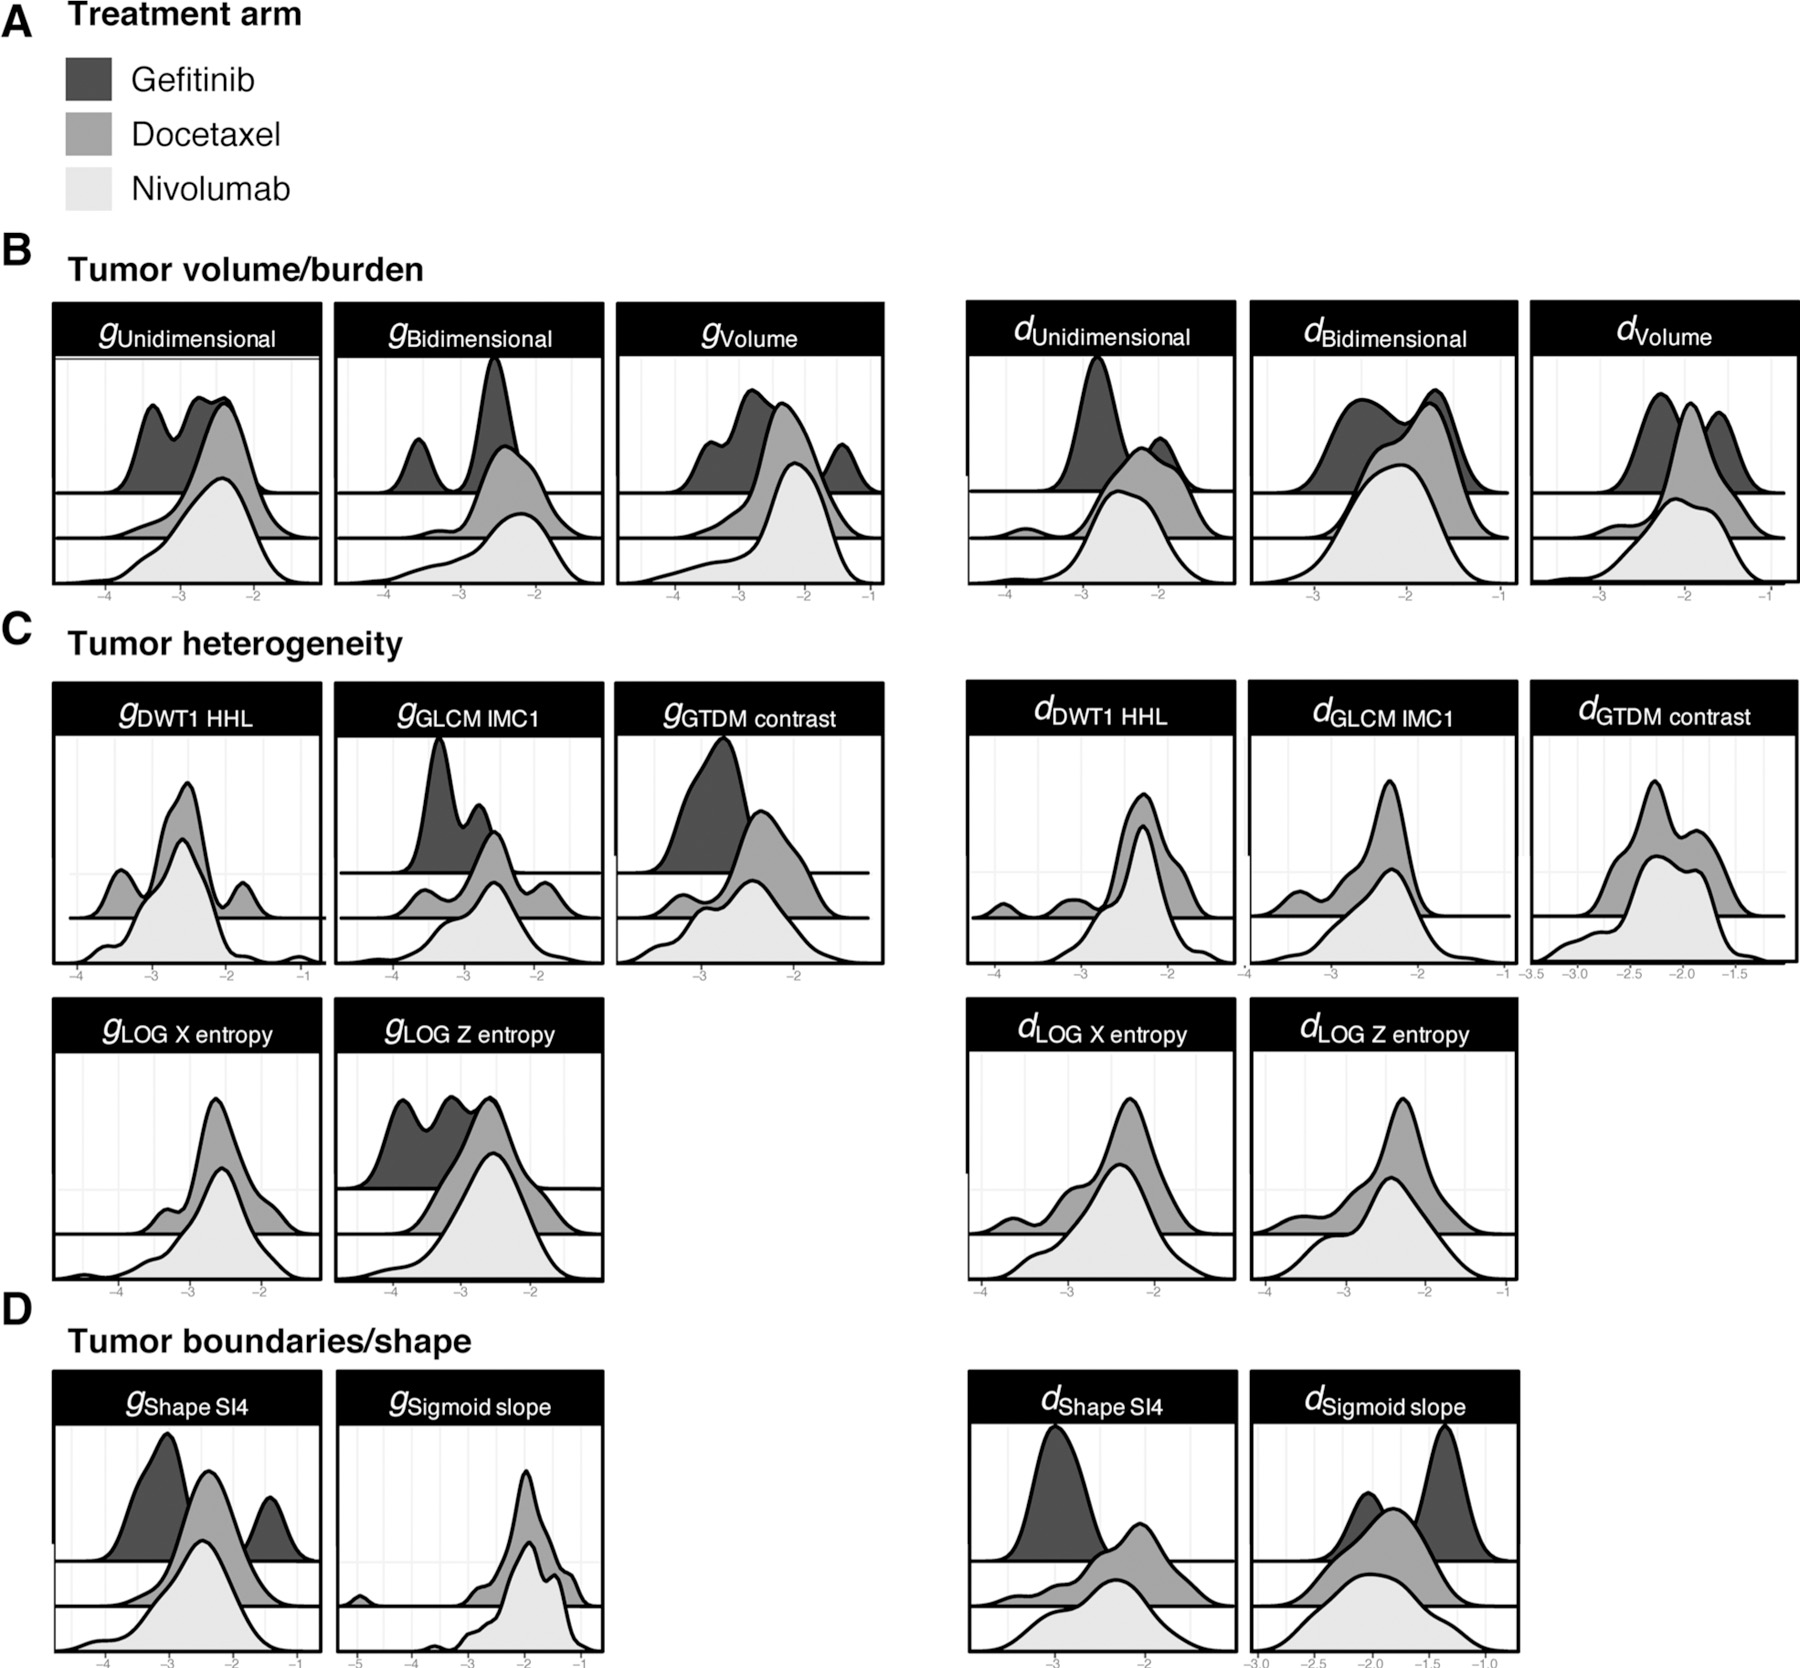
Distribution of the rates of patients with an exponential increase (g) or decrease (d) in the eight features included in the Radiomic signatures. Using serial radiographic measurements, the eight features discovered in the three signatures (nivolumab, docetaxel, gefitinib) (A) were generalized and applied to the all cohorts. Patients with exponential increase (g values) or decrease (d values) in Radiomic features are displayed using tumor burden (B), heterogeneity (C), and boundary features (D). This is a proof of concept that AI can be trained to differentiate the simultaneous occurrence of two processes in the overwhelming majority of tumors: exponential growth of the treatment-insensitive fraction of the tumor at a rate described by a growth rate constant designated g for growth, and exponential regression of the treatment-sensitive portion of the tumor, at a rate described by a regression rate constant designated d for decay. Strikingly, the distribution is bimodal in the Gefitinib cohort suggesting a wider variability between sensitive and insensitive tumors.
