
Figure 4.
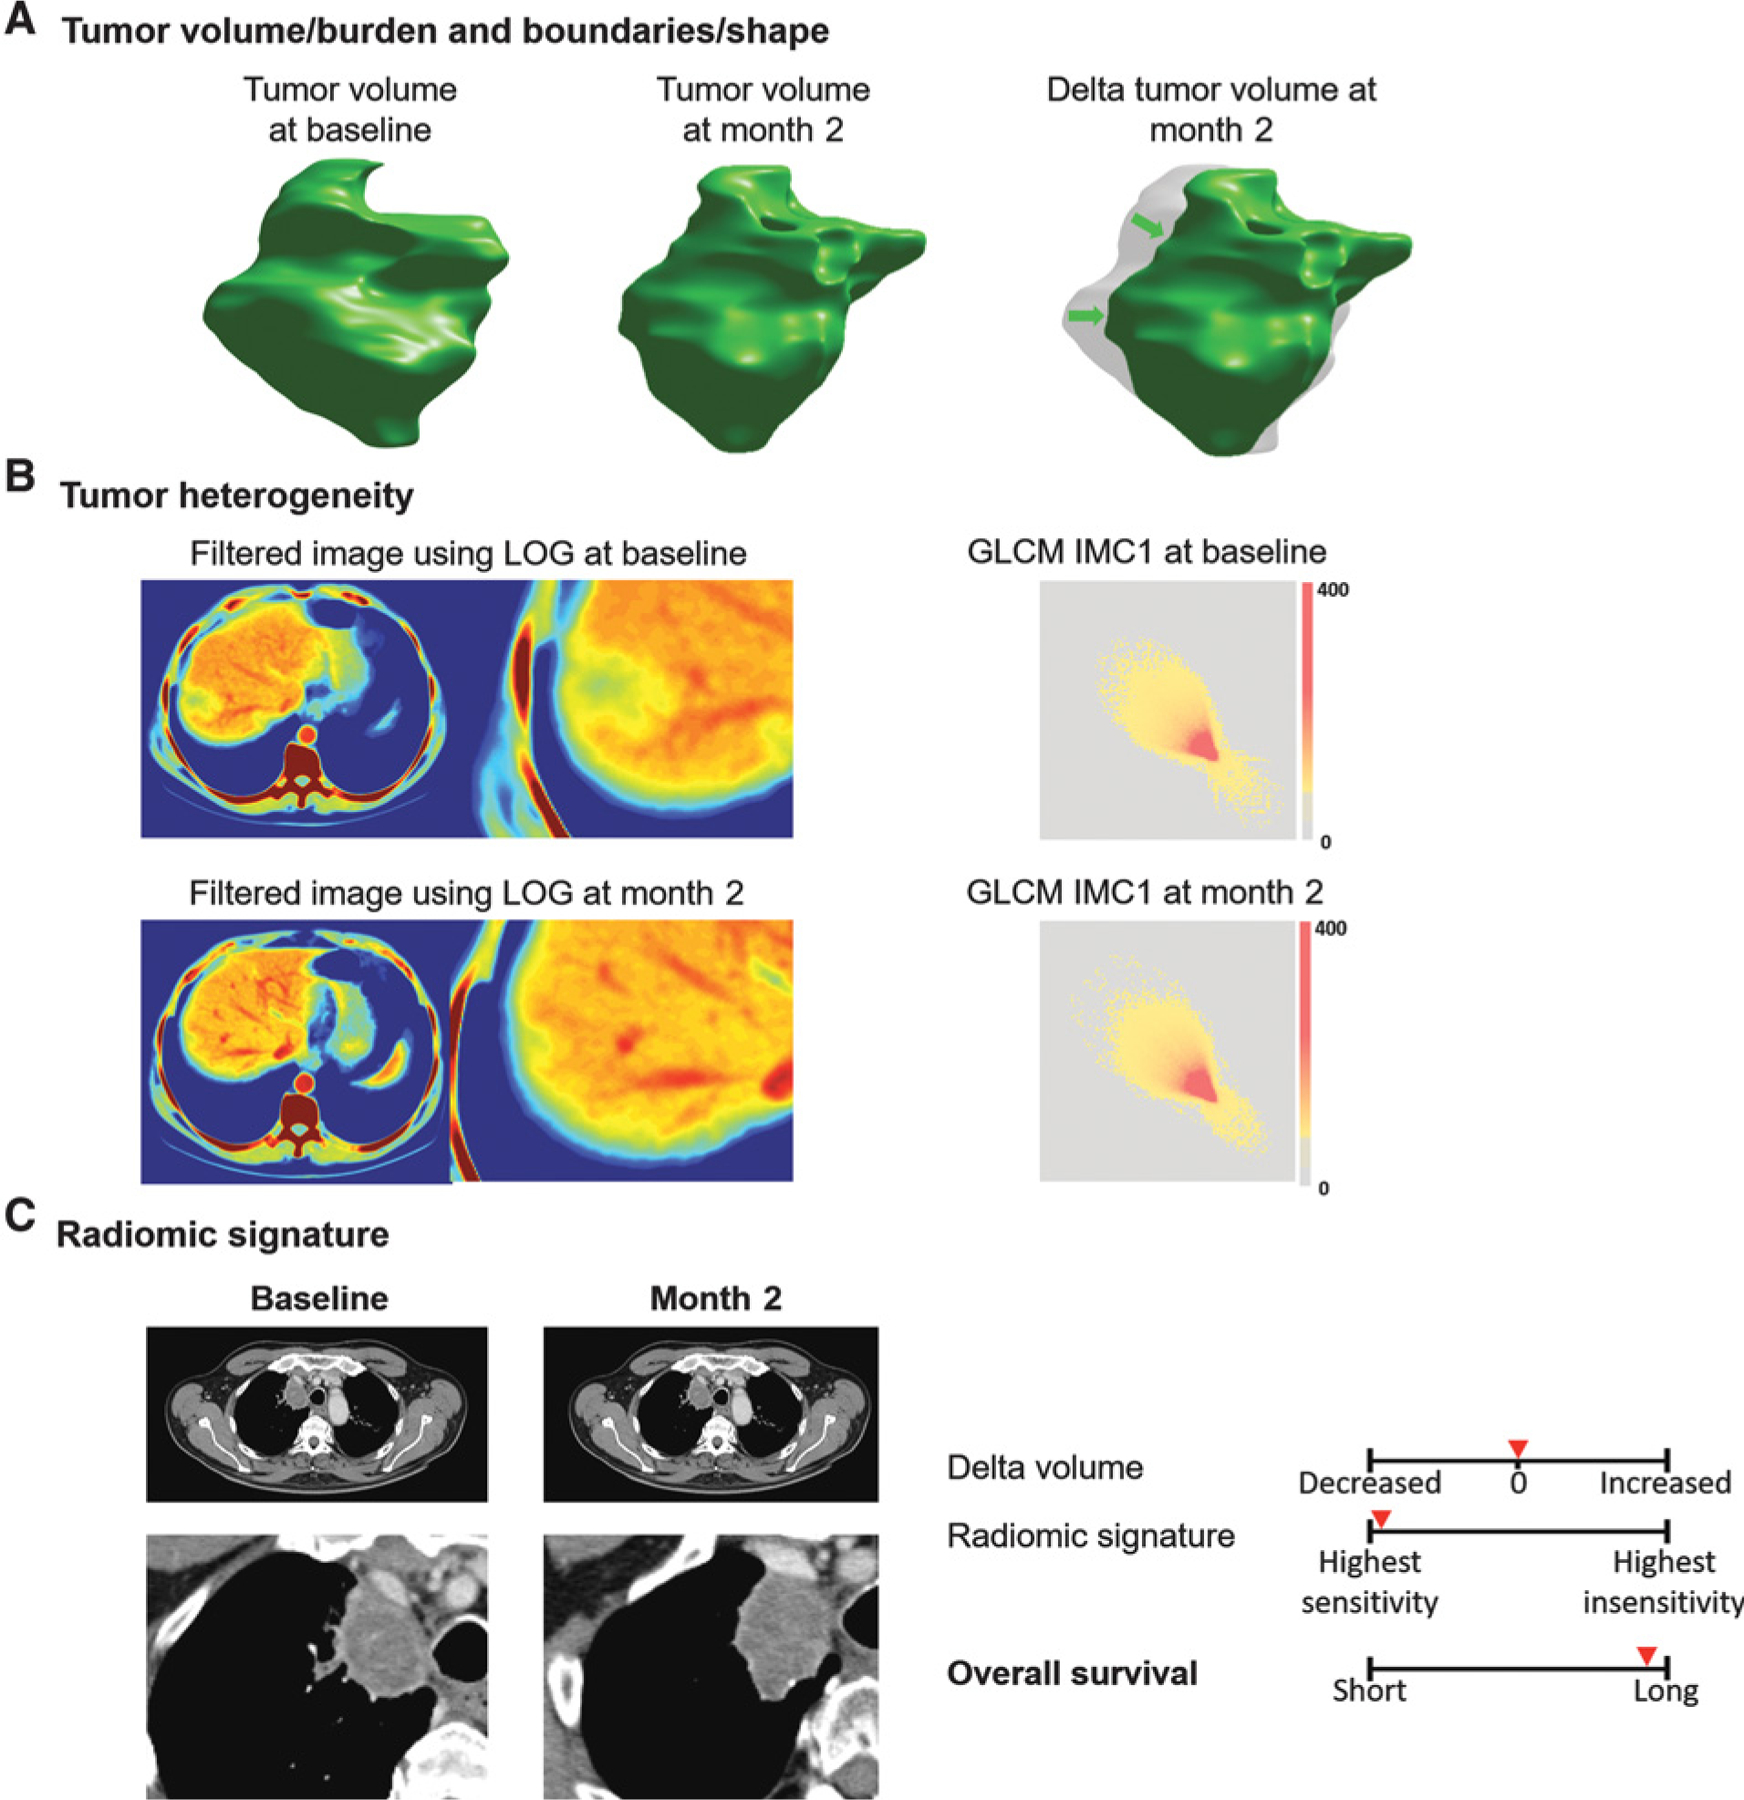
Distribution of the rates of patients with an exponential increase (g) or decrease (d) in the eight features included in the Radiomic signatures. Visual representation of the imaging features included in the signature. The changes in tumor imaging phenotype of the “most sensitive” patient treated with nivolumab is displayed below. Tumor was segmented, and its shape and volume are represented using volume rendering (A). As demonstrated, CT scan images are transformed to other mathematical spaces for feature extraction, e.g., CT image is transformed to LOG space for computing the entropy value (spatial heterogeneity), and tumor pixels within segmentation contour are transformed to GLCM matrix (B). Using this information, a radiomic signature predicts treatment sensitivity which is associated with patients’ OS (C).