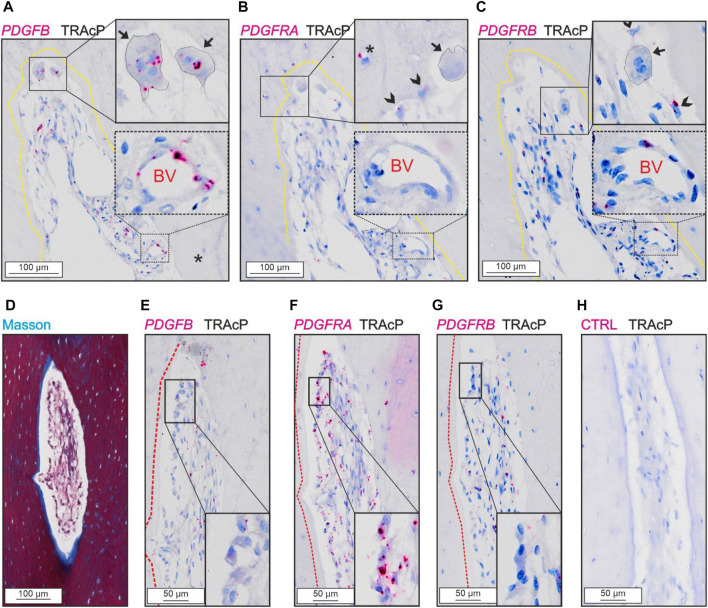
FIGURE 3.
Levels of PDGFRA and PDGFRB differ in cortical bone. (A–C) Adjacent sections of eroded pore with immunostaining of TRAcP (black) and in situ hybridization (red) of PDGFB (A), PDGFRA (B) and PDGFRB (C). (D–H) Adjacent sections of pore with bone formation with Masson Trichrome (D) or in situ hybridization of PDGFB (E), PDGFRA (F), PDGFRB (G) or negative control (H) combined with immunostaining of TRAcP (black). Eroded surfaces are marked by a yellow dotted line, formative surfaces are marked by a red dotted line. Osteoclasts are outlined and marked with black arrows, reversal cells with arrowheads and osteocytes with in situ signal are marked with (*), blood vessels are indicated with “BV”.

