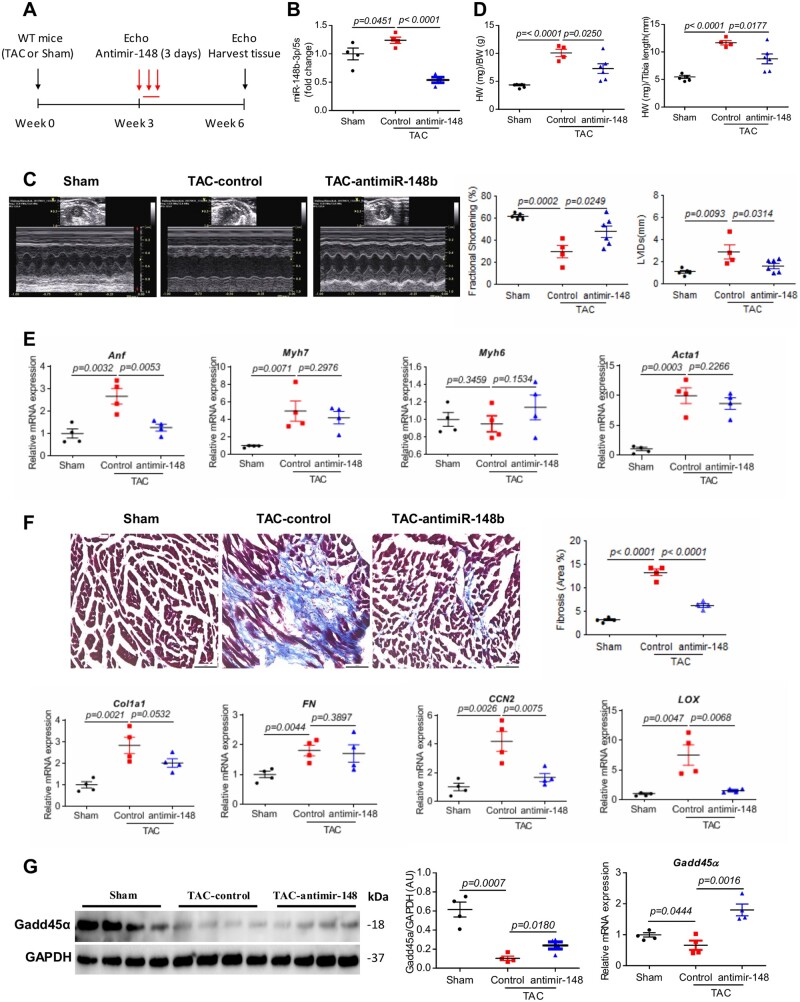
Figure 4.
Inhibition of miR148b-3p prevents and partially reverses cardiac remodelling and dysfunction. (A) Study protocol for anti-miR-148 therapy in TAC-induced WT mice HF. (B) Real-time PCR analysis of the expression levels of miR148b-3p in sham and TAC-WT mice ± anti-miR-148b-3p (n = 4). (C) Representative echocardiographic images and quantification of fractional shortening (FS%) and the left ventricular internal diameters in systole (LVIDs) (n = 4–6). (D) Analysis of heart weights (HW)/body weight (BW) and HW/tibia length ratios in sham and TAC-induced WT mice ± anti-miR-148b-3p (n = 4–6). (E) Real-time PCR analysis of the expression levels Anf, Myh7, Myh6, and Acta1(n = 4). (F) Representative images of Masson’s trichrome-stained hearts sections and myocardial fibrosis quantification as percentage of blue stained area (fibrotic) vs. control (scale bar, 50 µm, n = 4). Real-time PCR analysis of the expression levels of Col1a1, FN, CCN2, and LOX (n = 4). (G) Western blot (and densitometric quantification) and real-time PCR analysis of the expression of Gadd45α in sham and TAC-induced WT mice ± anti-miR-148b-3p (n = 4). Protein levels were normalized to GAPDH, a loading control; mRNA levels were normalized to 18S. N, each animal is shown as an individual point whereas horizontal lines represent median values as indicated. Values shown are mean± S.E.M., with each experiment performed in biological and technical replicates. Significance was evaluated by Student’s t-test or one-way ANOVA with Tukey’s post-hoc test. P values <0.05 were considered significant.

