Figure 3.
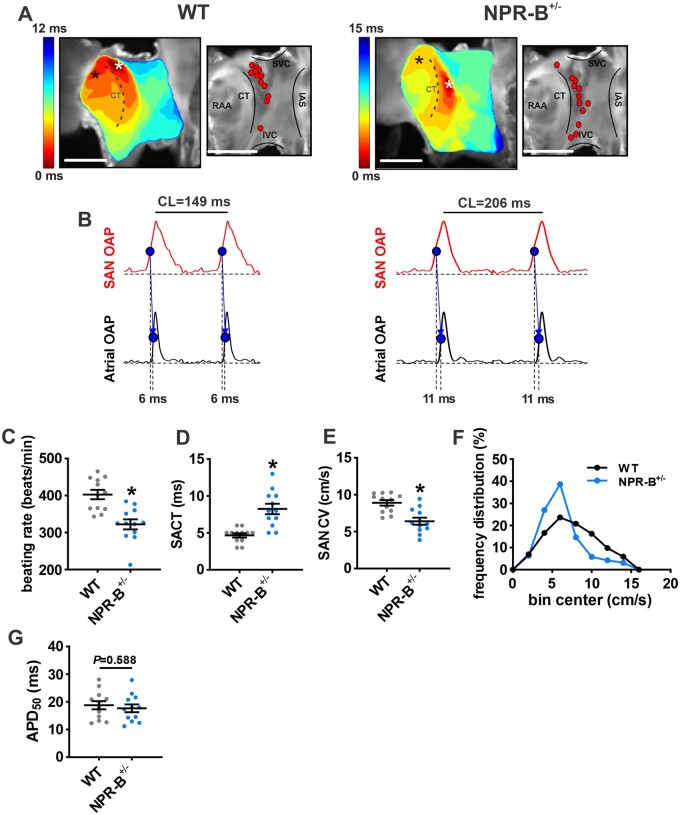
Assessment of electrical conduction in the SAN in NPR-B+/− mice. (A) Representative activation maps (left) and maps showing location of leading activation sites (right) for WT and NPR-B+/− mice. Red dots represent leading activation sites for different WT and NPR-B+/− hearts. Scale bars = 2 mm. (B) Optical action potentials (OAPs) from the initial pacemaker site in the SAN region (white asterisk on activation map) and earliest right atrial activation site (black asterisk on activation map) from WT (left) and NPR-B+/− (right) mice. These optical APs were used to quantify SAN to atrial conduction time (SACT). (C–F) Summary of atrial preparation beating rate (C), SACT (D), SAN conduction velocity (CV; E), frequency distribution of CV in the SAN (F) and optical APD50 (G) for WT (n = 12) and NPR-B+/− (n = 12) hearts. For (C,D,G), *P < 0.001 vs. WT by Student’s t-test. For (E), *P < 0.001 vs. WT by Mann–Whitney U test.

