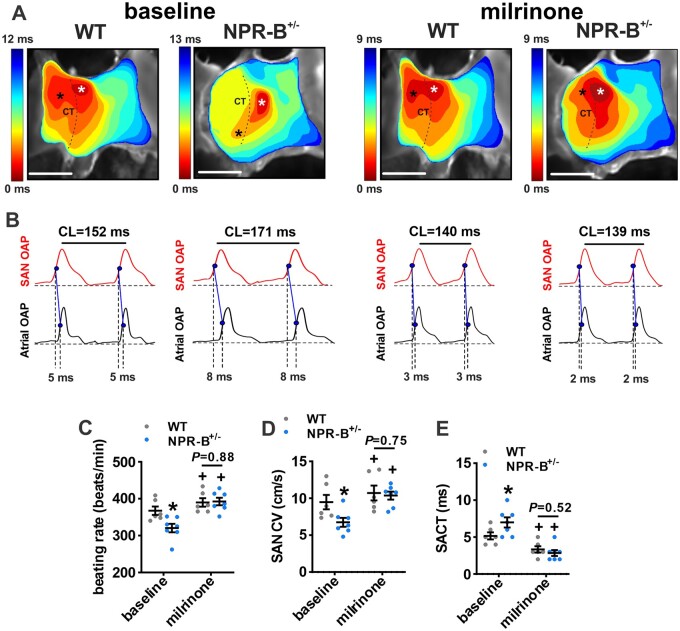
Figure 7.
Effects of PDE3 inhibition on electrical conduction in the SAN in NPR-B+/− mice. (A) Representative activation maps for WT and NPR-B+/− hearts at baseline and after PDE3 inhibition with milrinone (10 µM). Scale bars = 2 mm. (B) Optical action potentials (OAPs) from the initial pacemaker site in the SAN region (white asterisk on activation maps) and earliest right atrial activation site (black asterisk on activation maps) from WT and NPR-B+/− hearts at baseline and in the presence of milrinone. Dashed lines illustrate SACT for these examples. (C–E) Summary of atrial preparation beating rate (C), SAN conduction velocity (CV; D), and SACT (E) for WT (n = 6) and NPR-B+/− (n = 7) hearts at baseline and after application of milrinone. For (C–E), *P < 0.05 vs. WT; +P < 0.05 vs. baseline by two-way repeated measures ANOVA with Holm–Sidak post hoc test.

