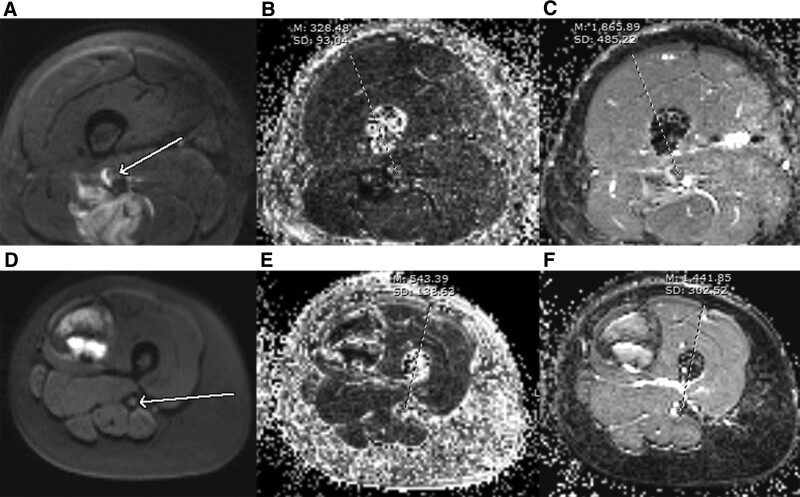
Figure 1.
A comparison in ADC and FA between invasion and noninvasion. (A–C) were respectively diffusion-weighted map, FA map, and ADC map for a nerve invasion case. (D–F) were respectively diffusion-weighted map, FA map, and ADC map for a case without nerve invasion. The FA value was significantly lower in the invaded nerve versus the normal nerve (B, D, red arrows). The ADC value was significantly higher in the invaded nerve versus the nerve free from tumor (C, F, red arrows). ADC = apparent diffusion coefficient; FA = fraction of anisotropy.

