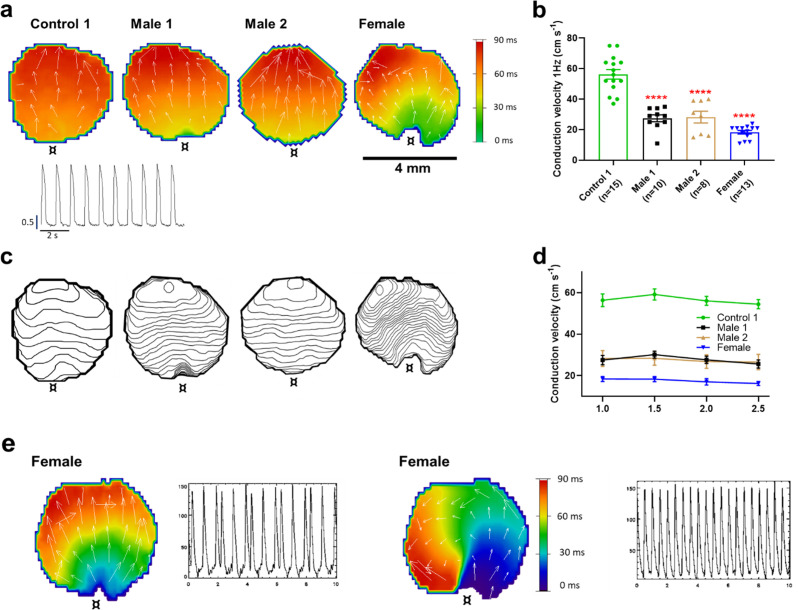
Figure 4. Conduction velocity (CV) is slower in iPSC-CM monolayers from Duchenne Muscular Dystrophy (DMD) hemizygous male and heterozygous female than control.
(a) Activation maps of action potential propagation at 1 Hz. Each color represents a different activation time with time zero appearing in green (¤ indicates the location of the stimuli for each monolayer). White vectors (↑) are a measure of local velocity and direction of the wave. Inset. Representative optical action potentials (APs) at 1 Hz. (b) Bar graphs of CV in each monolayer group, as indicated. Numbers in parenthesis are number of monolayers per group. (c) Averaged 2-ms contour isochrone maps for each representative monolayer above. Tighter averaged isochrone contours in the hemizygous and heterozygous iPSC-CM monolayers indicate slowed and more heterogeneous CV compared to control. (d) CV restitution tended to slow in all groups as pacing frequency increased. (e) Arrhythmias in heterozygous female iPSC-CMs monolayers. Left map, spontaneous pacemaker activity; Left inset, single pixel recording reveals premature ectopic discharges in a pattern of trigeminy; right map, high-frequency reentrant tachycardia maintained by a self-sustaining rotor; right inset, single pixel recording shows the interbeat interval (500 ms) of the reentrant tachycardia. Errors bars represent standard error of the mean (SEM). The n values are in parentheses. Two-tailed Mann–Whitney test. ****p < 0.0001.
Figure 4—figure supplement 1. Conduction velocity in control BJ iPSC-CM (Control 2) monolayer.

Figure 4—figure supplement 2. Cx43 expression level in control, hemizygous, and heterozygous Duchenne Muscular Dystrophy (DMD) iPSC-CMs.


