. 2022 Jun 28;11:e74819. doi: 10.7554/eLife.74819

Figure 1. The transition to livestock association in the 1960s was accompanied by changes in the frequencies of three mobile genetic elements (MGEs).

(a) A maximum likelihood phylogeny of 1180 isolates of CC398, rooted using an outgroup from ST291. Grey shading indicates the livestock-associated clade. Outer rings describe (1) the host groups isolates were sampled from, and the presence of three MGEs: (2) a Tn916 transposon carrying tetM, (3) a SCCmec carrying mecA, and (4) a φSa3 prophage carrying a human immune evasion gene cluster. (b) A dated phylogeny of a sample of 250 CC398 isolates that shows livestock-associated CC398 originated around 1964 (95% HPD: 1957–1970).

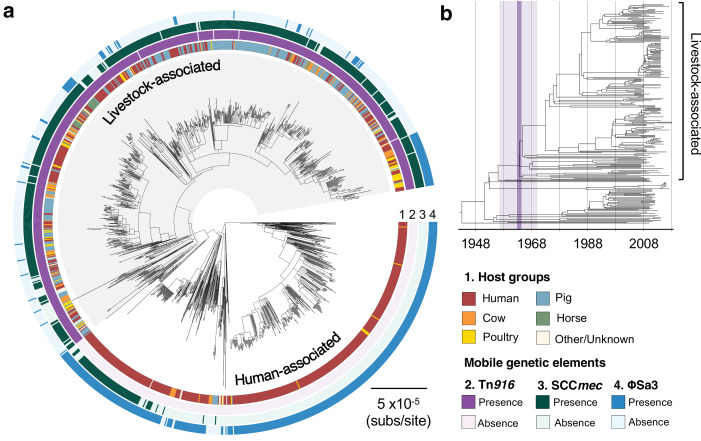
Figure 1.

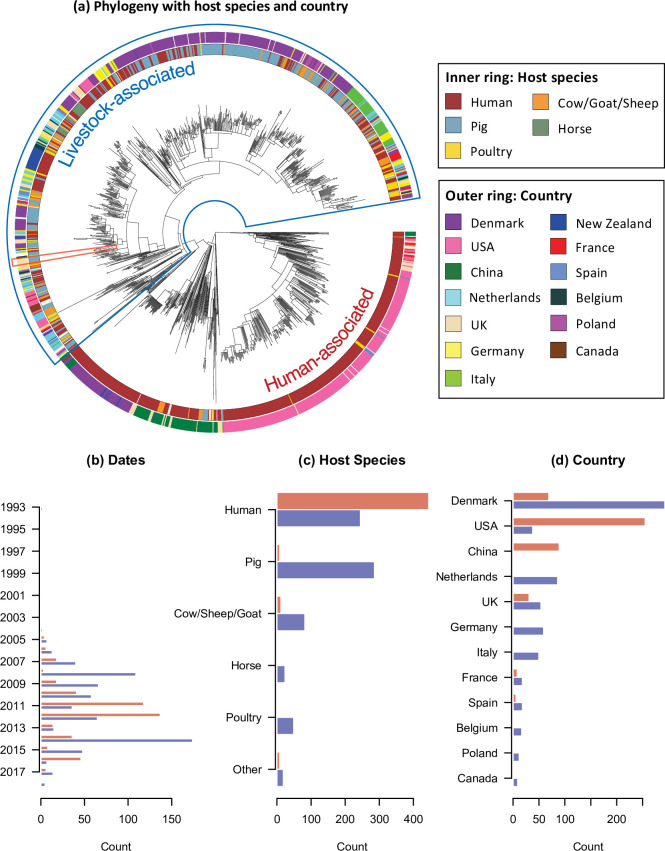
Figure 1—figure supplement 1. The temporal, host species, and geographic distribution of our collection of CC398 isolates.

Figure 1—figure supplement 1.

(a) Phylogeny of CC398 with rings showing the host species and countries of origin for each isolate (groups with n < 10 not shown). The blue outline indicates the livestock-associated clade, and the red outline indicates the five most recent isolates in our collection (sampled in 2018), from pigs on UK farms. (b), (c), and (d) show the variation in sampling date, host species, and country across the livestock-associated (blue, lower) and human-associated (red, upper) clades.
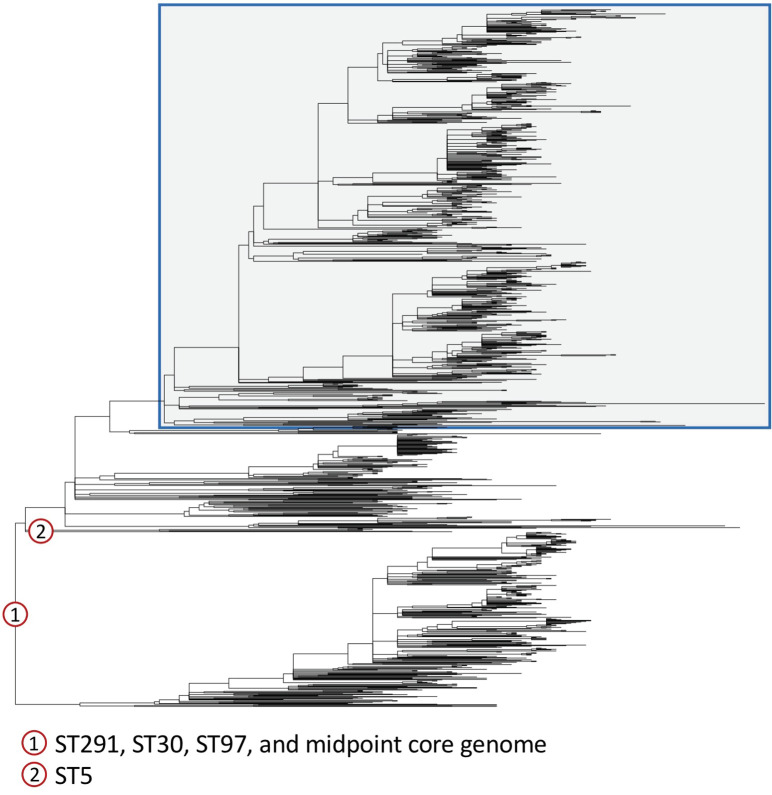
Figure 1—figure supplement 2. Different outgroups consistently identify the root of CC398 within human-associated CC398.

Figure 1—figure supplement 2.

We constructed maximum likelihood phylogenies using a reference-mapped alignment of CC398 combined with four outgroups from sequence types (STs) 291, 30, 97, and 5; and using a core genome alignment of our de novo assemblies and a midpoint rooting. The outgroups we used covered a range of distances from the base of CC398: ST291 (ERR2729529) is ~0.005 subs/site, ST30 (ERS1420125) is ~0.012 subs/site, and ST97 and ST5 (ERR2729579 and SRS613151) are ~0.015 subs/site. The reference-mapped phylogenies that were rooted using ST291, ST30, and ST97, and the midpoint-rooted core genome phylogeny all showed a consistent root, which is shown in the figure (and indicated by 1). A different root was obtained when we used the outgroup of ST5 (location indicated by 2). This root is on a neighbouring branch to the root found in the four other reconstructions, and results in CC398 being rooted on the branch leading to a single isolate (ZTA09_03734_9HSA). Livestock-associated CC398 is indicated by a blue box with grey shading.
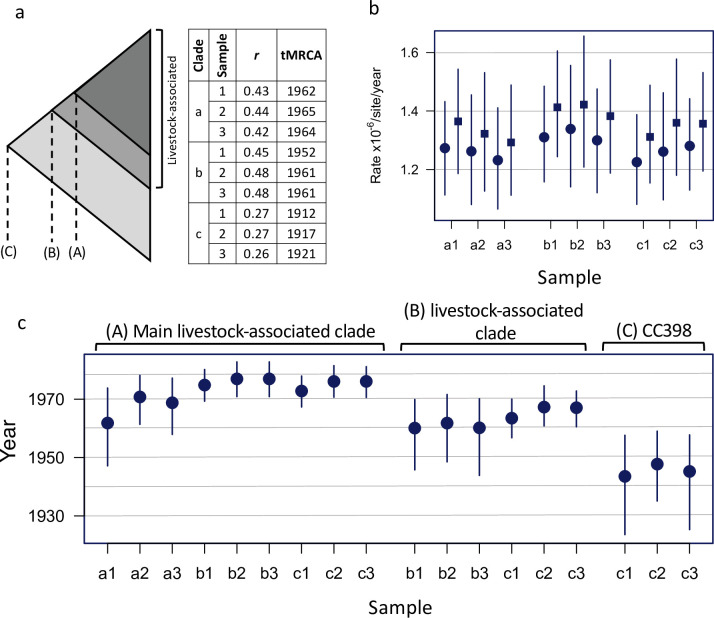
Figure 1—figure supplement 3. A consistent estimate of the age of the livestock-associated clade.

Figure 1—figure supplement 3.

Results of BEAST dating analyses estimating (A) the origin of a shallower subclade within the livestock-associated clade, (B) the origin of the entire livestock-associated clade, and (C) the origin of CC398. (a) The figure shows a schematic representation of the CC398 phylogeny indicating the nodes of interest (A–C), and our sampling strategy. We randomly sampled our dataset three times to generate samples of 250 isolates (200 from the livestock-associated clade and 50 from the human-associated clade). Samples overlapped by only 30 isolates that represent the most divergent lineages of the livestock-associated clade, to ensure a consistent description of the most recent common ancestor. Each sample had the same range of sampling dates (1993–2018). (a) also describes the results of a regression of root-to-tip distance against sampling date (correlation coefficient and estimate of the date of the most recent common ancestor) for each sample (1–3), and subsamples that include isolates from (A) only the main livestock-associated clade, (B) only the livestock-associated clade, and (C) the entire sample. As we observed stronger temporal signal for A and B, than for C, we estimated dated trees using BEAST for each of these nine subsampled datasets. We observed consistent estimates of evolutionary rate across all these analyses (b). Rates at first/second codon positions are shown as circular points, and at third codon positions as square points. These analyses also returned broadly consistent estimates of dates (c). Although we found that estimates from subsamples that included outgroups of the node being dated returned more precise and marginally more recent estimates of age, likely due to more information about the location of the root.
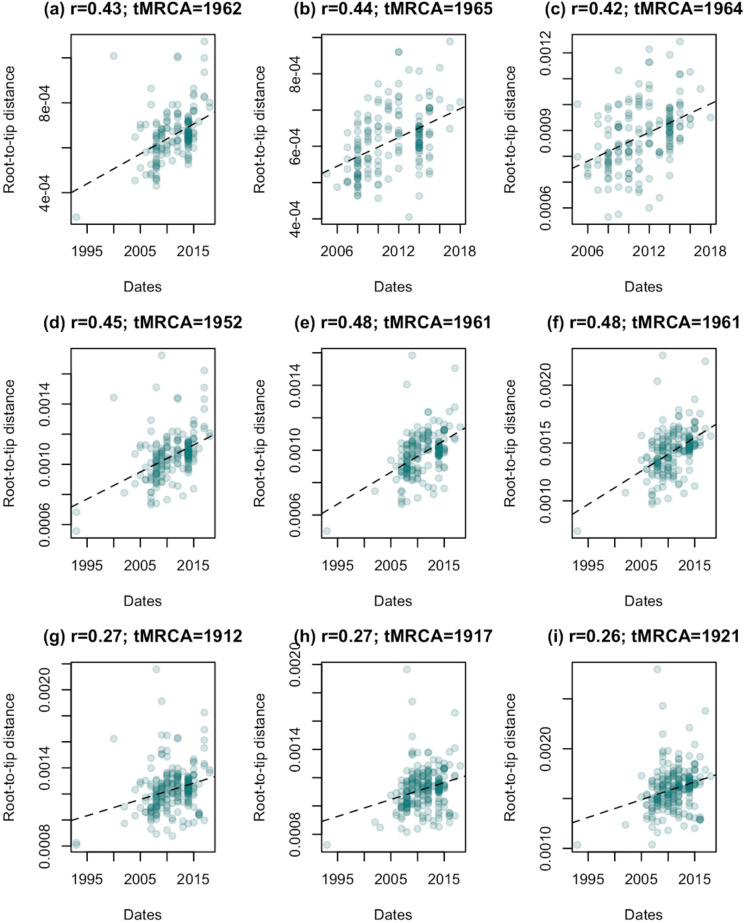
Figure 1—figure supplement 4. Evidence of temporal signal is present across in our subsampled datasets, but is stronger when isolates from the human-associated group are excluded.

Figure 1—figure supplement 4.

Regressions of root-to-tip distance against sampling date for each of our datasets, rooted to minimise residual mean squares. (a)-(c) show the results for samples 1, 2, and 3 for clade a (described in Figure 1—figure supplement 3), (d)-(f) the results for samples 1, 2, and 3 for clade b, and (g)-(i) samples 1, 2, and 3 for clade c. For all datasets a randomisation test indicated that these correlations were unlikely to have arisen by change (p < 0.01). Correlation coefficients (r) and estimates of the time of the most recent common ancestor (tMRCA) based on the regression are shown for each dataset.
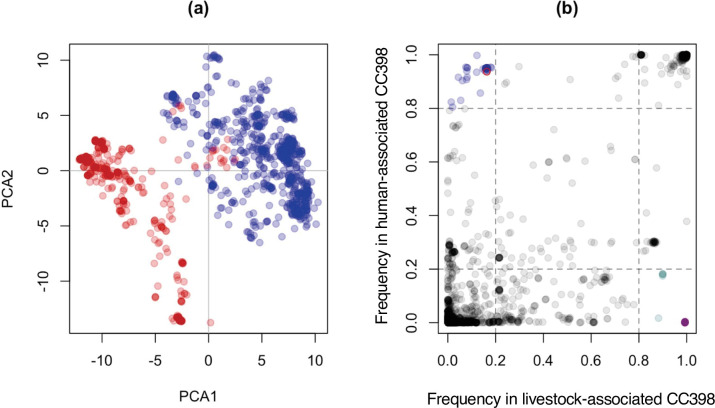
Figure 1—figure supplement 5. Livestock- and human-associated CC398 have divergent accessory genomes, and genes whose presence/absence most clearly distinguish these groups (except one) are associated with a Tn916 transposon, SCCmec, and φSa3 prophages.

Figure 1—figure supplement 5.

(a) A plot of the first and second principal components of accessory genome content, with isolates from human-associated CC398 in red and isolates from livestock-associated CC398 in blue. This was constructed using the package adegenet in R (Jombart, 2008). (b) Comparison of gene frequencies across the human- and livestock-associated groups. Genes present in <20% of human-associated CC398 and >80% of livestock-associated CC398 and genes presence in >80% of human-associated CC398 and <20% livestock-associated CC398 are highlighted, with genes associated with the Tn916 transposon shown in purple (all are overlapping as they have identical frequencies), genes associated with SCCmec shown in turquoise, and genes associated with φSa3 prophages shown in blue. The one gene that distinguishes livestock-associated CC398 from human-associated CC398 that is not associated with one of these three mobile genetic elements (MGEs) is shown as a red circle (tatC).