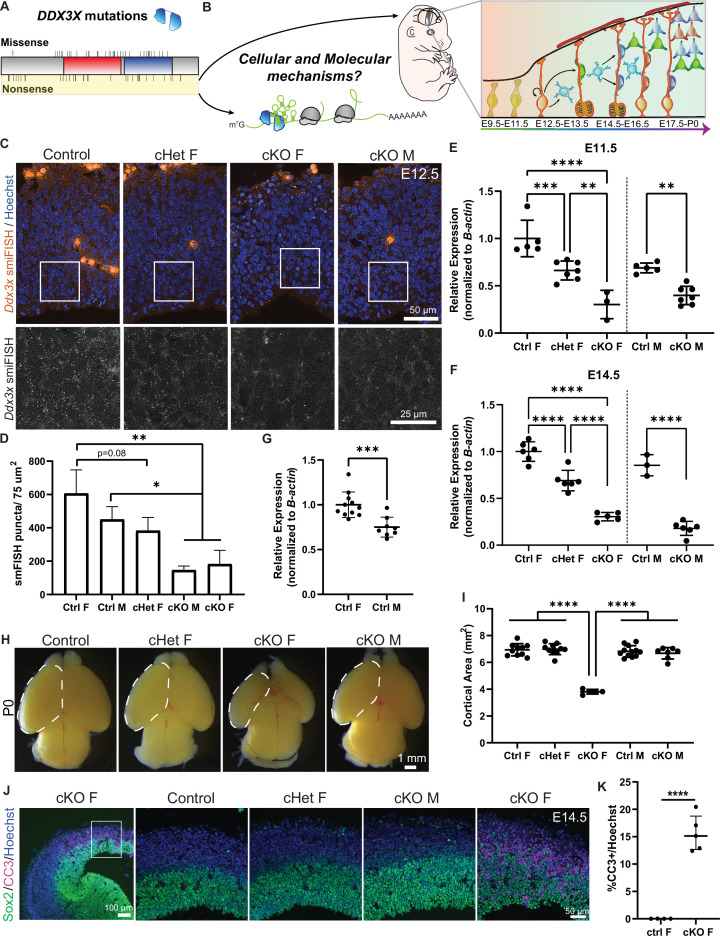
Figure 1. Conditional knockout of Ddx3x in neural progenitors using Emx1-Cre leads to microcephaly in female mice.
(A) Schematic of DDX3X protein with human missense and nonsense mutations noted, along with helicase/RNA binding domains (red, blue). Nonsense mutations, highlighted in yellow, are predicted to act in a LoF manner. (B) (Left) DDX3X protein bound to an mRNA undergoing translation. (Right) Mouse embryo and corticogenesis showing neuroepithelial cells (light green), radial glial cells (RGCs, orange), intermediate progenitors (IPs, light blue), and neurons (multi-colored); Figure 1B adapted from Figure 1A and B from Hoye and Silver, 2021. This study asks how does Ddx3x LoF impair mouse embryonic cortical development at a cellular and molecular level? (C) Representative sections of smFISH for Ddx3x in control, cHet female, and cKO male and female E12.5 cortices. (D) Quantification of Ddx3x smFISH signal in respective genotypes at E12.5. n=2–3 embryos/condition (E, F) Validation of Ddx3x mRNA knockdown in Tdtomato + cells from female (F) (control, cHet, cKO) and male (M) (control, cKO) brains sorted via FACS at E11.5 (E) and E14.5 (F). n=3–7 embryos/condition. (G) Quantification of Ddx3x levels in Tdtomato + cells from control female and male brains. n=8–10 embryos/condition. (H) Representative whole mount images of control, cHet female, and cKO male and female brains at P0. (I) Quantification of cortical area at P0. n=5–12 embryos/condition. (J) Representative sections of E14.5 brains stained with Sox2 (green), CC3 (magenta) and Hoechst (blue) showing low-magnification on left panel, and high magnification on 4 panels to the right. (K) Quantification of CC3 + cells in E14.5 control and cKO female cortices. n=4–5 embryos/condition. Scale bars, indicated. Error bars, S.D. *p<0.05, **p<0.01, ***p<0.001, ****p<0.0001. One-way ANOVA with Tukey’s (D, E, F, I), Student’s unpaired, two-tailed t-test (G, K).


