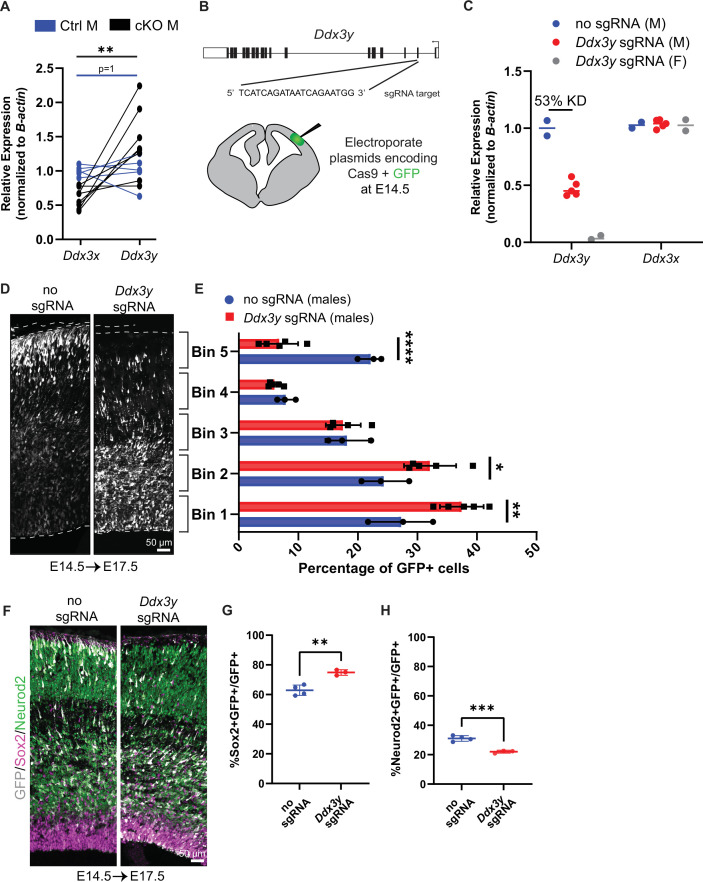
Figure 2. Ddx3x knockout is sexually dimorphic and Ddx3y phenocopies Ddx3x loss.
(A) RT-qPCR quantification of Ddx3x and Ddx3y mRNA levels in FACS-isolated Tdtomato + cells from cKO male E11.5 cortices. n=5–8 embryos/condition. (B) Schematic of Ddx3y CRISPR sgRNA electroporation of E14.5 brain. (C) RT-qPCR quantification of Ddx3y and Ddx3x levels in GFP +FACS-isolated cells from E17.5 male and female mice electroporated with pCAG-GFP and either no sgRNA or Ddx3y sgRNA. n=2–5 embryos/condition. (D) Representative sections of E17.5 male brains electroporated at E14.5 with pCAG-GFP and either no sgRNA or Ddx3y sgRNA and stained with anti-GFP (grey). Dotted lines, ventricular and pial surfaces; brackets delineate equivalently sized bins. (E) Quantification of distribution of GFP + cells. n=3–5 embryos/condition. (F) Same as (D), but sections were stained with anti-GFP (grey), Sox2 (magenta), and Neurod2 (green). (G, H) Quantification of GFP co-localization with Sox2 (G) or Neurod2 (H). n=3–5 embryos/condition. Scale bars, indicated. Error bars, S.D. *p<0.05, **p<0.01, ***p<0.001, ****p<0.0001. Student’s paired, two-tailed t-test (A), Two-way ANOVA with Sidak’s (E), Student’s unpaired, two-tailed t-test (G, H).

