. 2022 Jun 28;11:e78203. doi: 10.7554/eLife.78203

Figure 3. Ddx3x depletion leads to more RGCs and mature IPs, and fewer excitatory neurons across laminar layers.

(A) Representative sections from E14.5 cortices stained with Sox2 (magenta) and Tbr2 (green) (control M and cKO M shown). (B, C) Quantification of density of Sox2+ (RGCs) (B) and Tbr2 +Sox2- (mature IPs) (C) cells relative to all cells (Hoechst) at E14.5. n=7–8 embryos/condition. (D) Representative sections stained with Ctip2 (green), Tbr1 (red), and Lhx2 (green) from P0 control and cHet F/cKO M cortices (control M and cKO M shown). (E–G) Quantification of laminar marker density for Tbr1 (E), Ctip2 (F), and Lhx2 (G) relative to all cells (Hoechst). n=8–10 embryos/condition. Scale bars, indicated. Error bars, S.D. *p<0.05, **p<0.01. Student’s unpaired, two-tailed t-test (B, C, E–G).

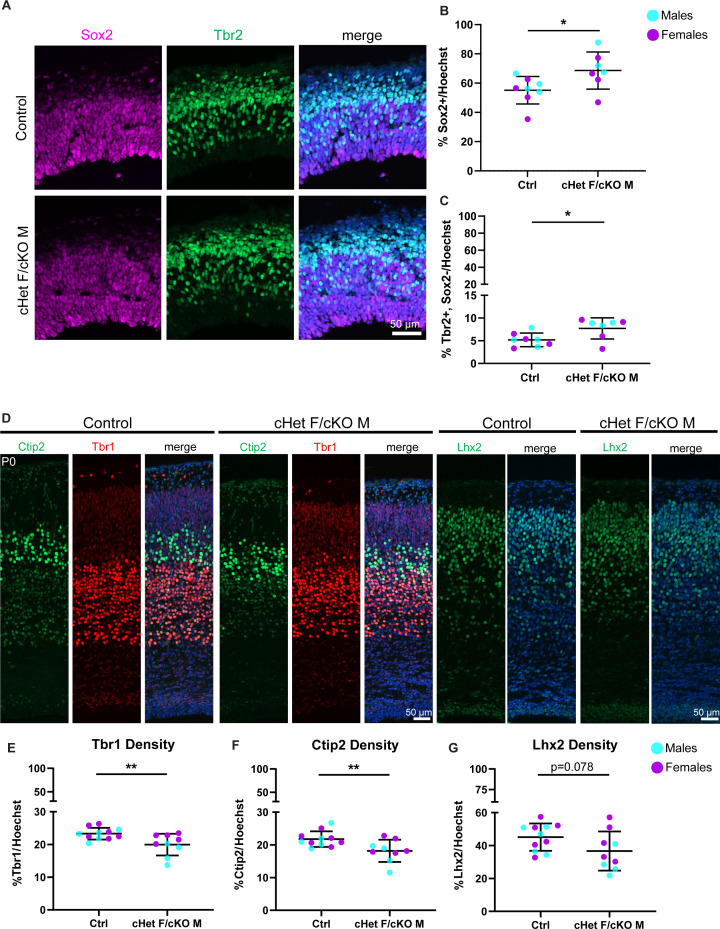
Figure 3.

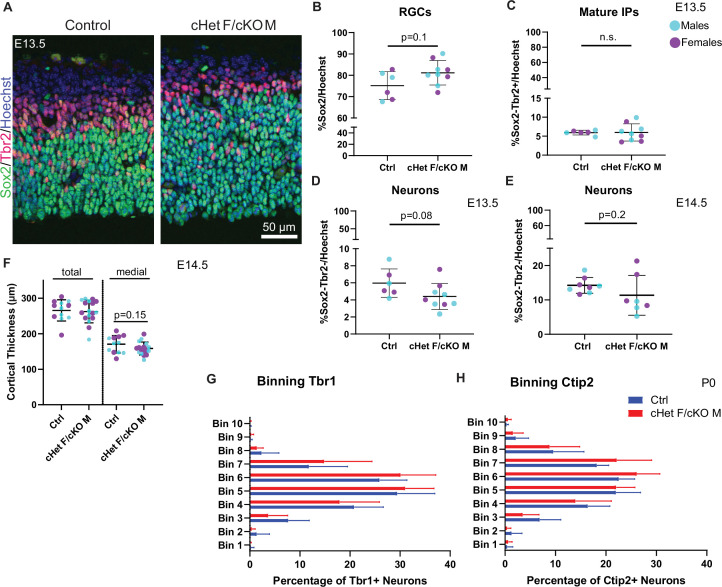
Figure 3—figure supplement 1. Ddx3x depletion leads to more progenitors and less neurons at E13.5, but does not affect cortical thickness or laminar position of neurons.

Figure 3—figure supplement 1.

(A) Representative coronal sections from control and cHet F/cKO M at E13.5 immunostained with Sox2 (green), Tbr2 (magenta) and Hoechst (control M and cKO M shown). (B–E) Quantification of RGCs (Sox2+) (B), mature IPs (Sox2-,Tbr2+) (C), putative neurons (Sox2-Tbr2-), density relative to Hoechst in control and cHet F/cKO M at E13.5 (D). n=6–9 embryos/condition. Sox2-Tbr2- density relative to Hoechst in control and cHet F/cKO M at E14.5. n=7–8 embryos/condition (E). (F) Quantification of cortical thickness at E14.5 in control and cHet F/cKO M measured medially and laterally (total) or just medially. n=12–17 embryos/condition. (G, H) Quantification of the distribution of Tbr1+ (G) and Ctip2+ (H) cells in control and cHet F/cKO M at P0. Student’s unpaired, two-tailed t-test (B–F), Two-way ANOVA with Sidak’s (G, H).