. 2022 Jun 28;11:e78203. doi: 10.7554/eLife.78203

Figure 6. Ribosome Profiling in embryonic brains uncovers the E11.5 translatome including DDX3X-dependent translation targets.

(A) Experimental paradigm for Ribo-seq and RNAseq of E11.5 cortices from control and cKO mice. n=3/sex/condition with four embryos pooled per n. (B) TE of transcripts enriched in RGCs, IPs, deep layer neurons (VI-V) and superficial layer neurons (IV-II) relative to all other mRNAs (TPM >10). Birthdates for laminar layers are indicated below. See Supplementary file 3 for exact transcripts. (C) ORFquant analysis of wildtype Ribo-seq data showing identification of annotated ORFs and uORFs in protein-coding and non-coding isoforms. (D) Schematic illustrating how DDX3X-dependent targets were prioritized. (E) Scatter plot of RPFs log2FC versus RNA log2FC for 59 DDX3X-dependent targets with significantly lower TE. Putative Ribo-seq targets selected for validation are highlighted in blue. (F) IGV screenshots illustrating RNAseq reads (gray) and RPFs (Ribo-seq; purple) for Topbp1 in cKO mice relative to control. (G) Representative trace from polysome fractionation of E14.5 cortical lysate. (H–M) RT-qPCR quantification of mRNA levels for Ribo-seq candidates in input samples at E11.5 (H) and at E14.5 (I), and monosome and polysome fractions at E11.5 (J) and E14.5 (K–M). n=5–7/condition (H, J) and 4/condition (I, K–M) with two embryos pooled per n. Error bars, S.D. *p<0.05, **p<0.01. Two-sided Wilcoxon test (B), Student’s unpaired, two-tailed t-test (H–M).

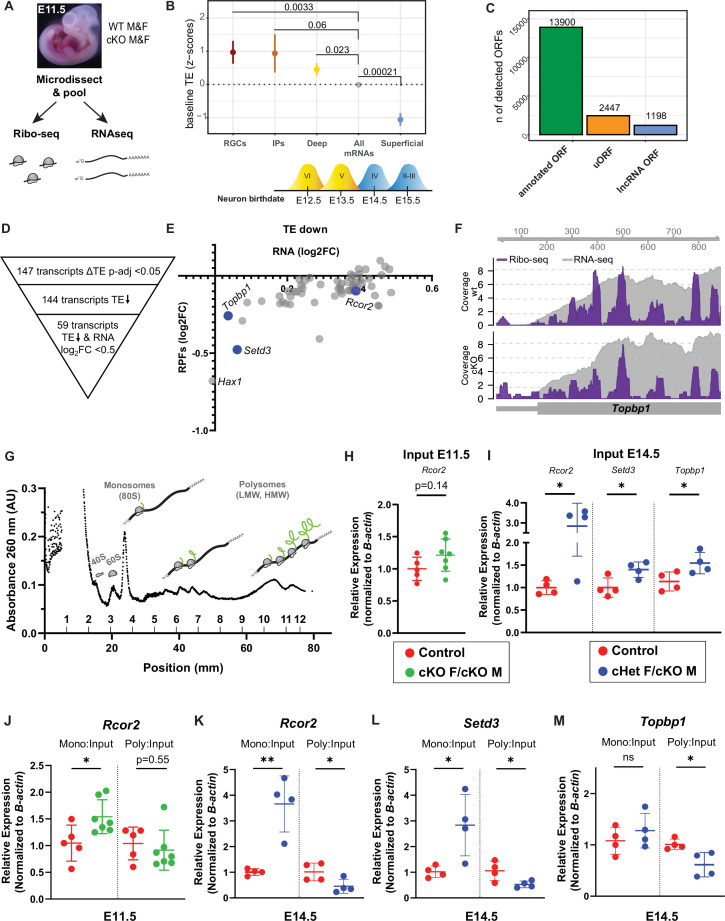
Figure 6.

Figure 6—figure supplement 1. Quality Control Assessment of Ribosome Profiling in Ddx3x cKO mice.

Figure 6—figure supplement 1.

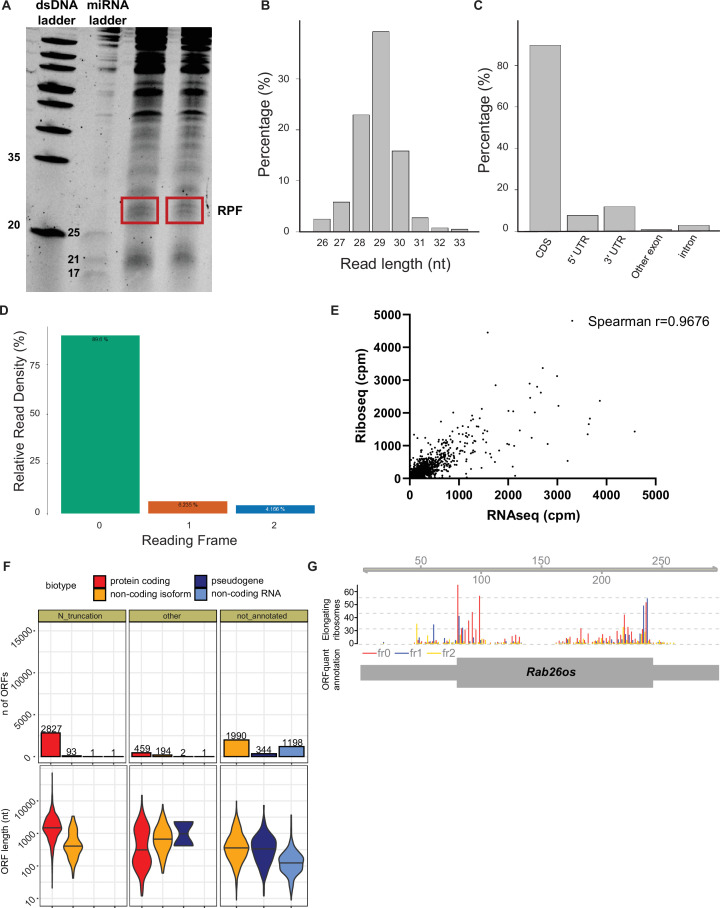
(A) Representative denaturing urea gel of embryonic cortices treated with RNase I illustrating RPFs (red box). (B–D) RibosomeProfilingQC assessment of deep sequencing of cDNA libraries showing read length distribution (B), percent of reads mapping to CDS and UTRs, etc (C), and reading frame (D). (E) Comparison of RNAseq cpm and Riboseq cpm using all reads from all transcripts from WT data (excluding non-polyA histone and multi-mapping ribosomal genes); Spearman r=0.9676. Five transcripts were omitted when reducing axes for readability. (F) De novo identification of translated ORFs, including number of detected ORFs with their length (in nucleotides) for different ORF categories and annotated biotypes. (G) A novel translated ORF in the lncRNA Rab26os showing the P-sites position colored by frame (middle), and ORF quant-derived annotation (bottom).
Figure 6—figure supplement 1—source data 1. Quality Control Assessment of Ribosome Profiling.
Figure 6—figure supplement 2. Polysome fractionation and RNA immunoprecipitations showing DDX3X targets in the cortex.

Figure 6—figure supplement 2.

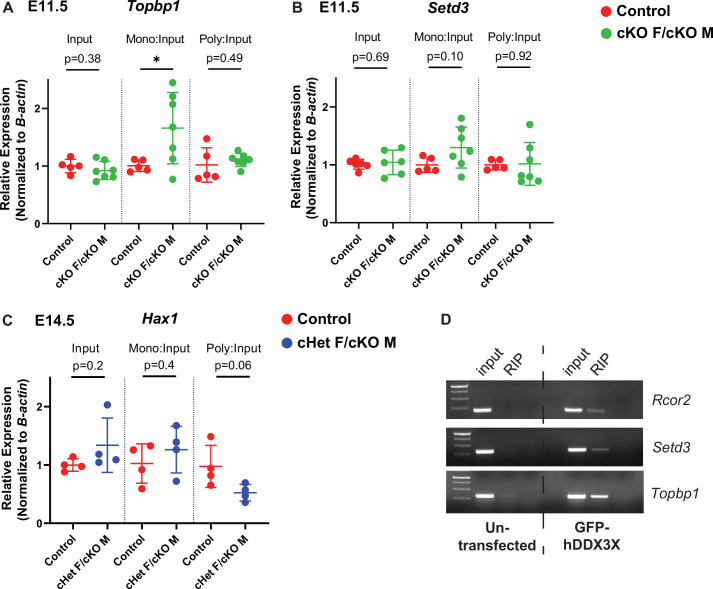
(A–C) RT-qPCR quantification of mRNA levels for Ribo-seq candidates in input samples, monosome and polysome fractions at E11.5 for Topbp1 (A) and Setd3 (B) and at E14.5 for Hax1 (C). (D) Representative gels of RNA immunoprecipitation of DDX3X translation targets, Rcor2, Setd3, and Topbp1. n=5–7 embryos/condition (A, B), 4 embryos/condition (C), 3 biological replicates (D). Student’s unpaired, two-tailed t-test (A–C).
Figure 6—figure supplement 2—source data 1. RNA immunoprecipitations of targets by DDX3X.