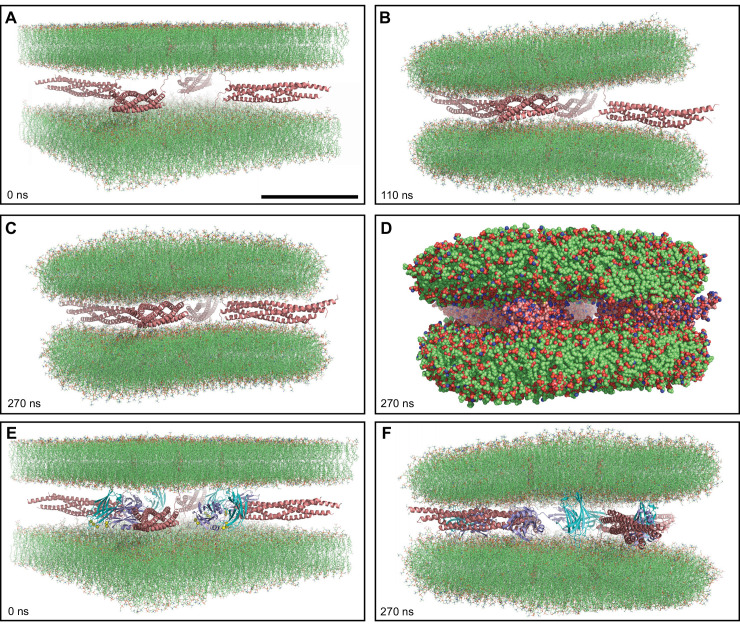
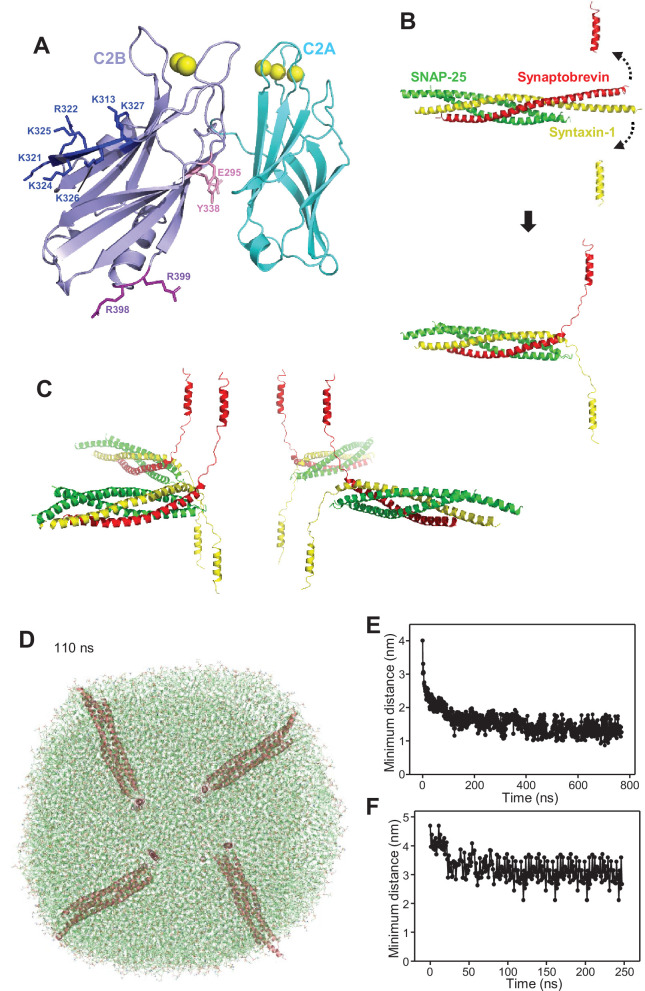
(A) Ribbon diagram of the conformation of Syt1 C2AB molecules used for the simulation of four trans-SNARE complexes and four C2AB molecules between two bilayers. The C2A domain is colored in cyan and the C2B domain in violet. Key side chains of the C2B domain mentioned in the text, which form the polybasic face (left) or the primary interface (right) are shown as stick models. The polybasic face side chains are colored in blue, and those from the primary interface are in pink (site I) or purple (site II). Ca2+ ions are shown as yellow spheres. (B) Illustration of the procedure used to general the initial structure of a trans-SNARE complex between two flat bilayers. A ribbon diagram of a crystal structure of the neuronal SNARE complex including the TM regions of synaptobrevin and syntaxin-1 (PDB accession code 3HD7) is shown in the middle on the left, with synaptobrevin in red, syntaxin-1 in yellow and SNAP-25 in green. Ribbon diagrams above and below show the positions designed for the TM regions. A 1 ns MD simulation with restraints to force these positions of the TM regions and additional restraints to keep the heavy atoms of the N-terminal half of the SNARE four-helix bundle (up to the polar layer) at their initial positions led to the structure illustrated by the ribbon diagram on the right. (C) Ribbon diagrams of the four trans-SNARE complexes generated for the system with two flat bilayers. Three copies of the original structure obtained by the 1 ns restrained MD simulation were generated and then rotated and translated to yield this final configuration. (D) Snapshot of the MD simulation of four trans-SNARE complexes between two flat bilayers after 110 ns viewed from the top to illustrate that the flat bilayers acquired an almost circular shape. The SNARE complexes are illustrated by ribbon diagrams in salmon. The lipids are shown as thin stick models. The atom color code for the lipids is: carbon lime, oxygen red, nitrogen blue, phosphorous orange. (E) Minimum distance between atoms of the two flat bilayers in frames taken every 1 ns in the simulation of four trans-SNARE complexes between two bilayers. (F) Minimum distance between atoms of the two flat bilayers in frames taken every 1 ns in the simulation of four trans-SNARE complexes and four C2AB molecules between two bilayers.


