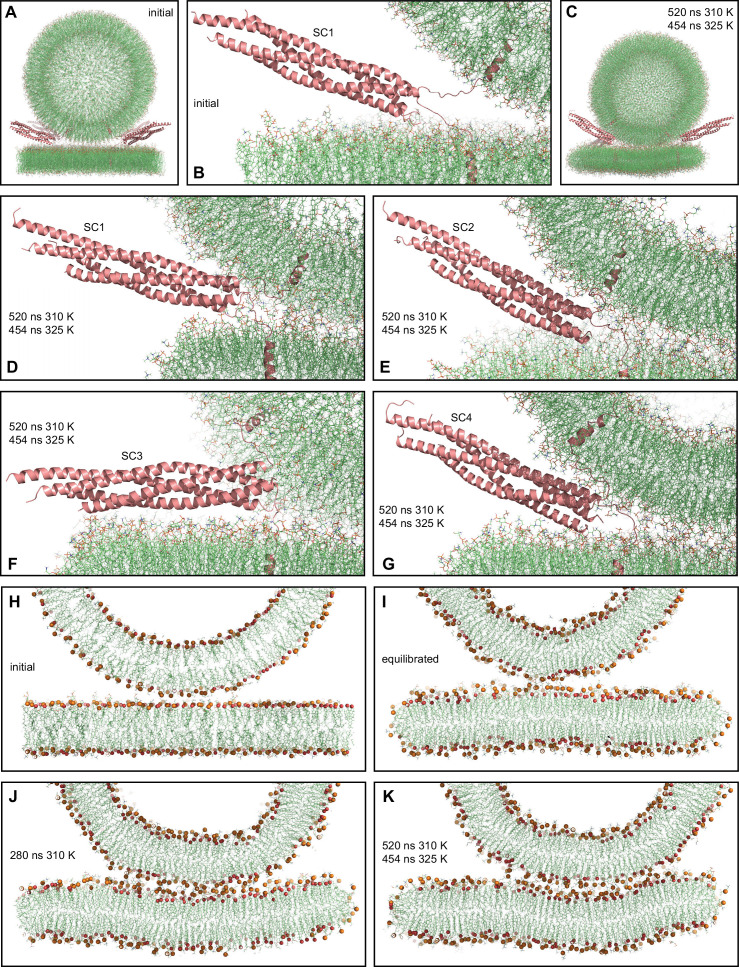
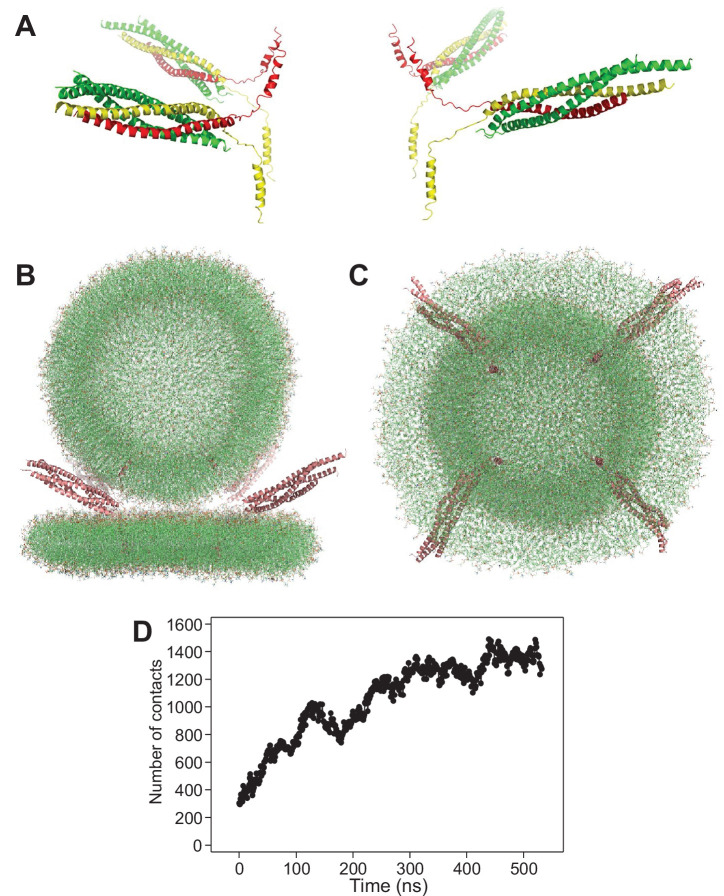
Figure 2. MD simulation of four trans-SNARE complexes bridging a vesicle and a flat bilayer.
(A) Overall view of the initial system. (B) Close-up view of one of the trans-SNARE complexes in the initial system. (C) Snapshot of the system after a 520 ns MD simulation at 310 K and a 454 ns simulation at 325 K. (D–G) Close-up views of the four trans-SNARE complexes (named SC1-SC4) after the 520 ns MD simulation at 310 K and the 454 ns simulation at 325 K. In (A–G), the SNARE complexes are illustrated by ribbon diagrams in salmon. The lipids are shown as thin stick models (carbon lime, oxygen red, nitrogen blue, phosphorous orange). (H–K) Thin slices of the system in its initial configuration (H), after the equilibration steps (I), after 280 ns at 310 K (J) and after 520 ns at 310 K and 454 ns at 325 K (K). In (H–K) Phosphorous atoms of phospholipids and the oxygen atoms of cholesterol molecules are shown as spheres to illustrate the approximate locations of lipid head groups.


