. 2022 Jun 16;11:e76356. doi: 10.7554/eLife.76356

Figure 5. MD simulation of C2AB bound to Ca2+ and to trans-SNARE complexes bridging a vesicle and a flat bilayer.
(A) Close-up view of the four C2AB-SNARE complexes in the initial system. (B) Close-up view of the system after a 439 ns MD simulation. (C–J) Close-up views of the assemblies between C2AB molecules (named C2AB1-4) and SNARE complexes (SC1-SC4) in the initial configuration (C,E,G,I) and after the 439 ns MD simulation (D,F,H,J). In all panels, the SNAREs are represented by ribbon diagrams in salmon and the Syt1 C2AB fragment by ribbon diagrams in cyan (C2A domain) and violet (C2B domain). Ca2+ ions are shown as yellow spheres. The lipids are shown as thin stick models (carbon lime, oxygen red, nitrogen blue, phosphorous orange).

Figure 5.

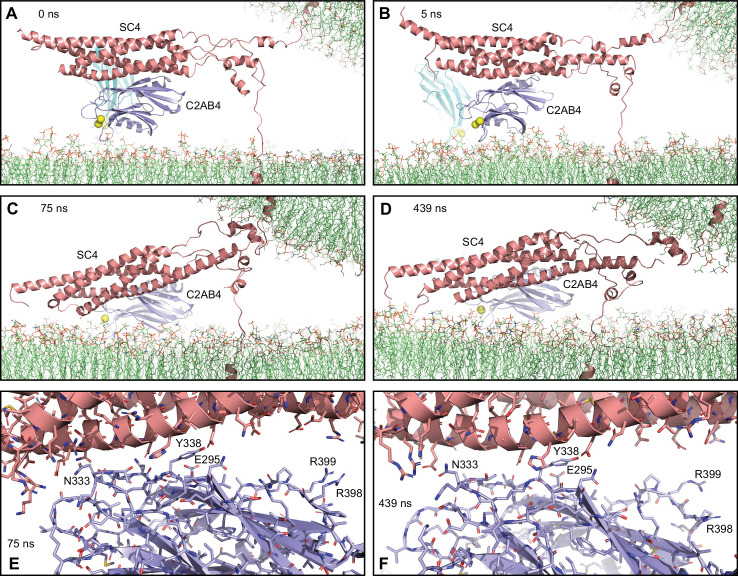
Figure 5—figure supplement 1. Additional views of the complexes from Figure 5.

Figure 5—figure supplement 1.

(A–D) Close-up views of SC4 and C2AB4 in the MD simulation of C2AB bound to Ca2+ and to trans-SNARE complexes bridging a vesicle and a flat bilayer in the initial configuration (A) and after 5, 75, and 439 ns (B–D), respectively.
The SNAREs are represented by ribbon diagrams in salmon and the Syt1 C2AB fragment by ribbon diagrams in cyan (C2A domain) and violet (C2B domain). Ca2+ ions are shown as yellow spheres. The lipids are shown as thin stick models (carbon lime, oxygen red, nitrogen blue, phosphorous orange). Note that in just the first 5 ns one of the helices that was disrupted was almost fully formed but overall there was no substantial progress toward assembly of the C-terminal part of the SNARE four-helix bundle in 439 ns. (E–F) Close-up views of the primary interface between SC4 and C2AB4 after 75 (E) and 439 (F) ns. The C2B domain and the SNARE complex are illustrated by ribbon diagrams and stick models with oxygen atoms in red, nitrogen atoms in blue, sulfur atoms in light orange and carbon atoms in violet [for the C2B domain] or salmon (for the SNAREs). The positions of selected side chains are indicated.
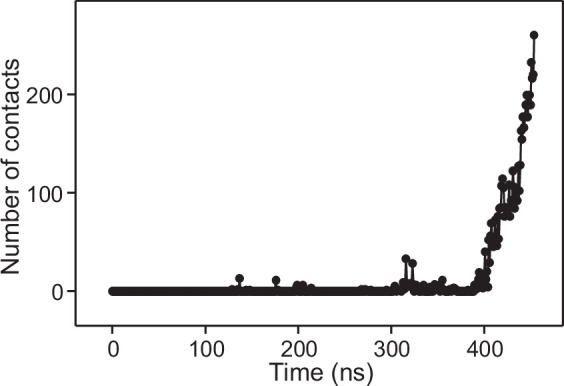
Figure 5—figure supplement 2. Number of contacts in frames taken at 1 ns steps in the MD simulation of C2AB bound to Ca2+ and to trans-SNARE complexes bridging a vesicle and a flat bilayer.
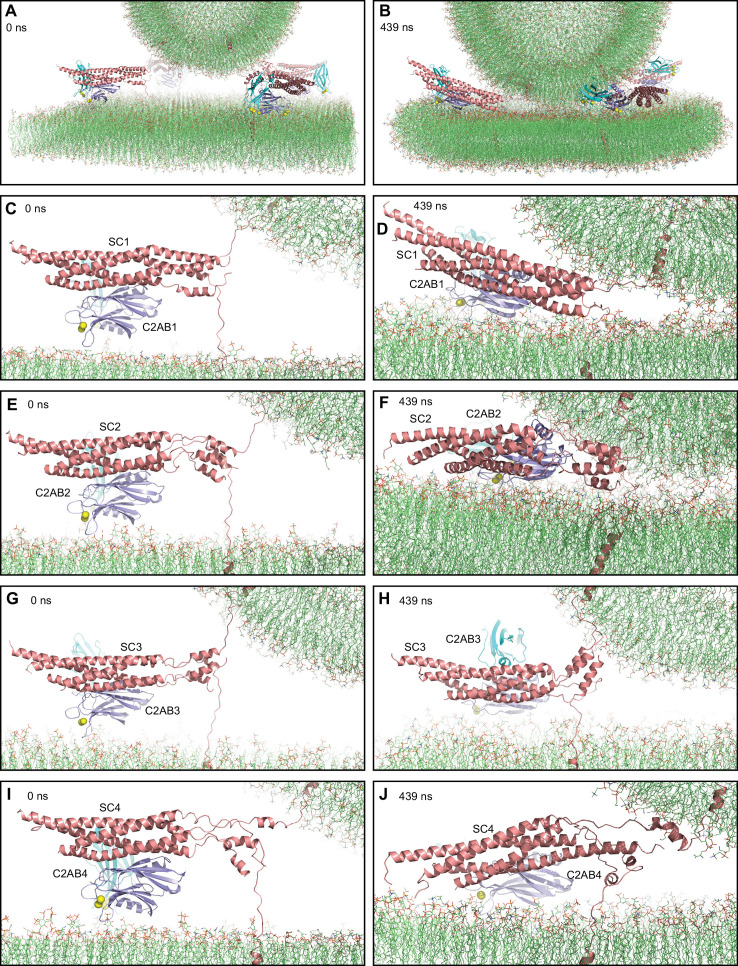
Figure 5—figure supplement 2.

The number of contacts was defined as the number of distances between oxygen atoms of the vesicle and oxygen atoms of the flat bilayer that were smaller than 1 nm.