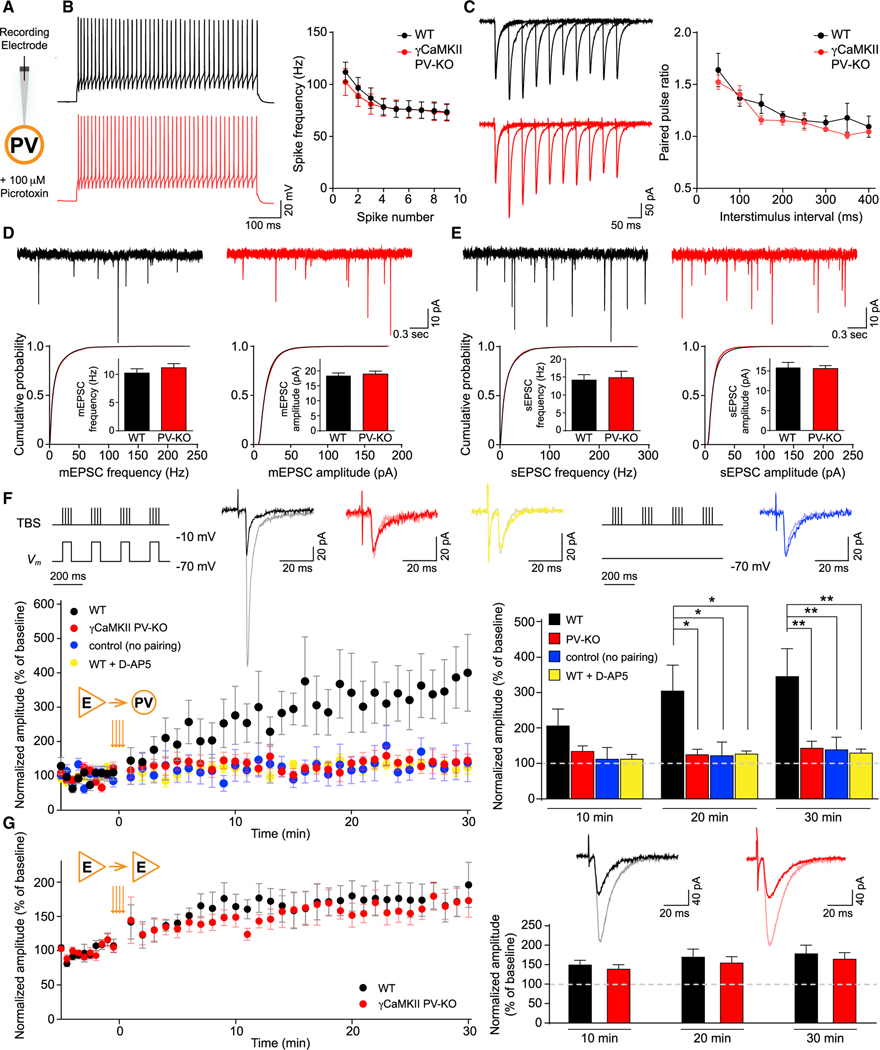
Figure 3. γCaMKII PV-KO mice have normal LTPE→E but impaired LTPE→I.
(A) Schematic illustration of recordings in PV+ interneurons. PV+ interneurons were identified by the virus-mediated expression of Cre-dependent fluorescent proteins, and pyramidal cells were identified by morphology.
(B) Left, example spike traces evoked by twice-threshold current injection in hippocampal PV+ interneurons. Right, spike frequency measured for the 1st–10th spikes (n = 5–6 cells from 2–3 mice/group).
(C) Example paired-pulse traces measured in hippocampal PV+ interneurons (left) and summary of paired-pulse ratio (right) at the indicated interstimulus intervals (n = 5–6 cells from 3–4 mice/group).
(D and E) Top, example traces of mEPSCs (D) and sEPSCs (E) measured in hippocampal PV+ interneurons of WT and PV-KO mice. Bottom, cumulative distribution plots and summary of mEPSC and sEPSC frequency and amplitude in WT and PV-KO mice (n = 5–22 cells from 2–5 mice/group).
(F) LTP in PV+ interneurons is impaired in γCaMKII PV-KO mice. Top, the stimulation pairing protocol for inducing LTP and the control protocol (no pairing) are shown schematically. Also shown are superimposed representative averaged EPSCs recorded 5 min before (dark traces) and 25 min after (light traces) LTP induction. The bottom panels show normalized amplitude before and after the TBS stimulation protocol (orange arrows) and the summary data measured 1–10, 11–20, and 21–30 min after LTP induction. There was no difference among the groups of WT (no pairing), WT (D-AP5), and γCaMKII PV-KO (n = 8–10 cells from 3–8 mice/group).
(G) LTP induced using a TBS pairing protocol in WT (black) and γCaMKII PV-KO (red) pyramidal neurons showed no difference (n = 6–8 cells from 5 mice/group). All recordings were performed with the GABAA receptor antagonist picrotoxin (100 μM) in the bath solution. PV+ interneurons were identified by the virus-mediated expression of Cre-dependent fluorescent proteins, and pyramidal cells were identified by morphology.
Data were analyzed using an unpaired Student’s t test or a two-way ANOVA followed by Tukey’s multiple comparison test, *p < 0.05 and **p < 0.01. See also Figures S4–S7.

