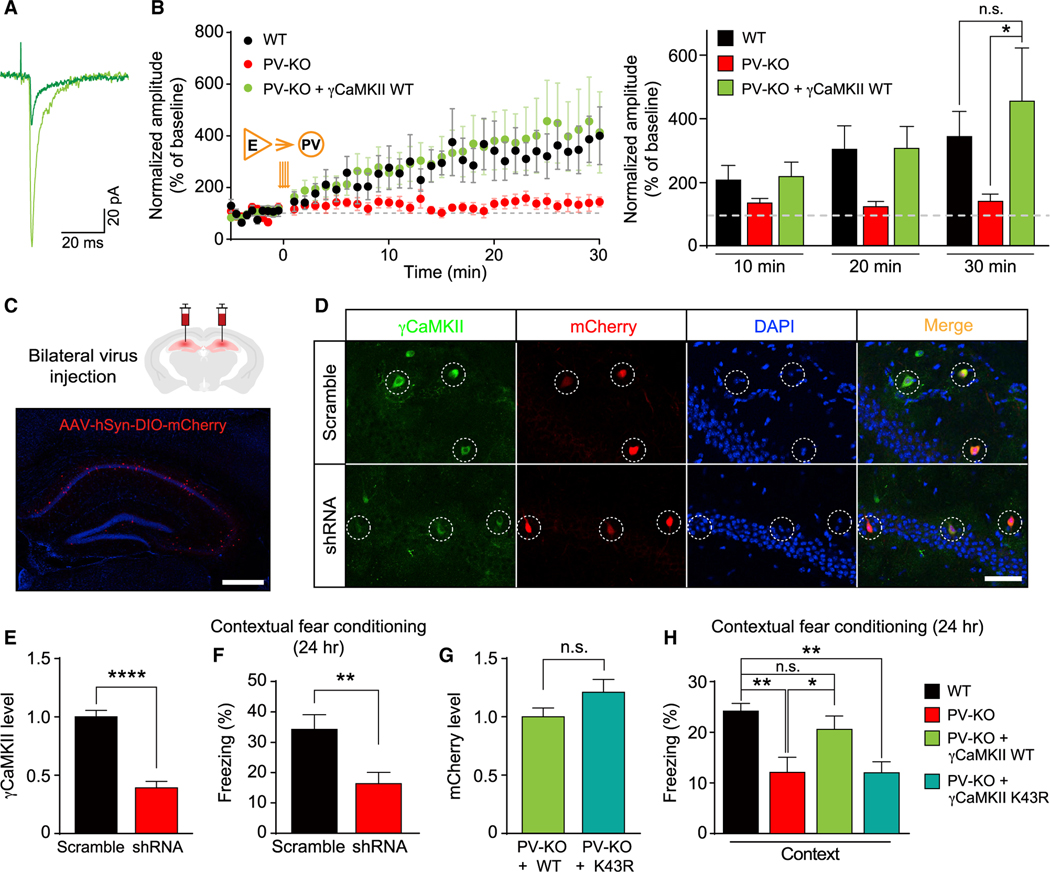
Figure 5. The functional role of γCaMKII in hippocampal PV+ interneurons in LTPE→I and hippocampus-dependent long-term memory.
(A and B) LTP of PV+ interneurons was rescued by virus-mediated re-expressing γCaMKII in the hippocampal PV+ interneurons of PV-KO mice (B) and superimposed representative averaged EPSCs recorded 5 min before (dark traces) and 25 min after (light traces) LTP induction in PV-KO mice (A). Note that the WT group and PV-KO data are also shown in Figure 3F (n = 8–19 cells from 6–15 mice/group), in which PV+ interneurons were identified by the virus-mediated expression of Cre-dependent fluorescent proteins.
(C) Top, schematic illustration of AAV-mediated expression of target genes in the mature hippocampus through bilateral stereotactic injection. Bottom, the representative image showing specific delivery and expression of AAV2/9-hSyn-DIO-mCherry-P2A-HA-HsγCaMKII (red) in the hippocampus. The nuclei were counterstained with DAPI (blue).
(D and E) Representative images (D) and summary data (E) showing that γCaMKII shRNA effectively knocked down the expression of γCaMKII in hippocampal PV+ interneurons in WT (PV-Cre) mice (n = 20–83 cells from 2–3 mice/group).
(F) Memory performance measured 24 h after CFC training in mice (WT, PV-Cre) that bilaterally express AAV-DIO-scramble shRNA or -γCaMKII shRNA in hippocampal PV+ interneurons (n = 9 mice/group).
(G) To compare levels of expressed γCaMKII, we measured mCherry intensity in hippocampal PV+ interneurons of PV-KO mice injected with the AAV2/9-hSyn-DIO-mCherry-P2A-HA-HsγCaMKII WT (+WT) virus or the AAV2/9-hSyn-DIO-mCherry-P2A-HA-HsγCaMKII K43R (+K43R) virus (n = 33–34 cells from 3 mice/group).
(H) The reduced contextual fear response in PV-KO mice is rescued by overexpressing WT γCaMKII but not the kinase-dead mutant form of γCaMKII (K43R) in the hippocampus (n = 7–26 mice/group). The virus-mediated expression of Cre-dependent fluorescent protein was used as the control in the black and red groups.
The data in (B) were analyzed using a two-way ANOVA followed by Sidak’s test; the data in (E)–(G) were analyzed using an unpaired Student’s t test; the data in (H) were analyzed using a one-way ANOVA followed by Sidak’s test. *p < 0.05, **p < 0.01, and ****p < 0.0001. Scale bar: 500 μm (C) and 50 μm (D). See also Figure S9.

