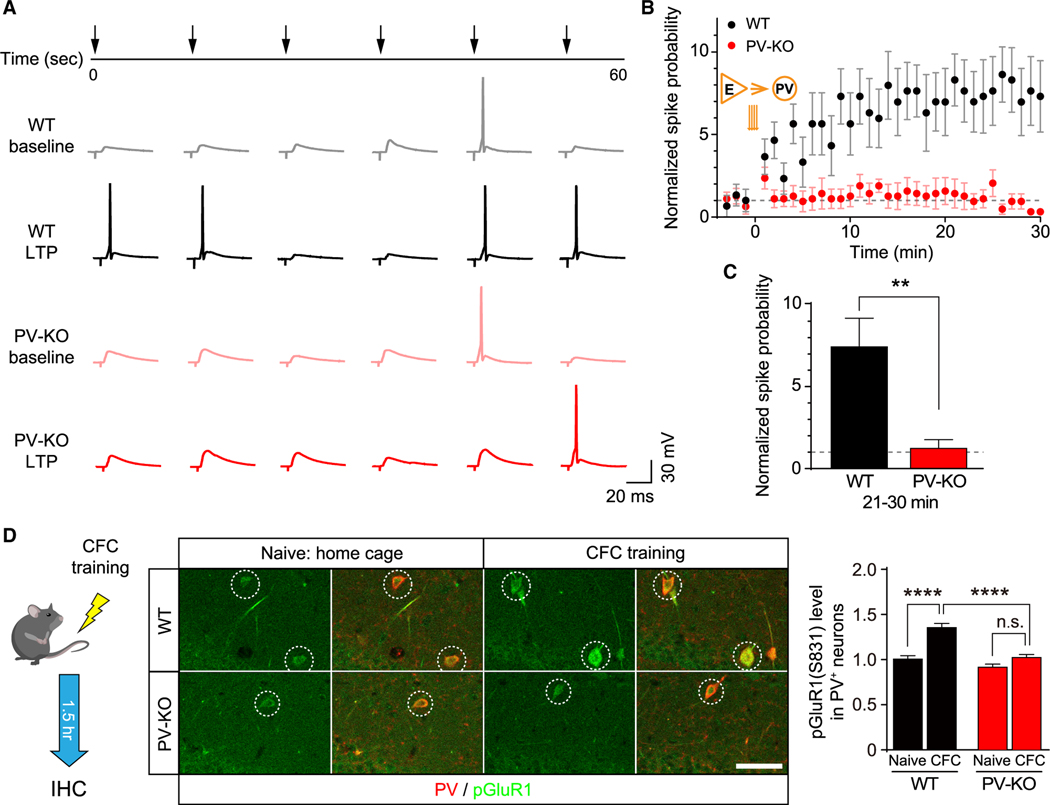
Figure 6. Impaired activity-dependent spike transmission coupling and phosphorylation of GluR1 in the hippocampus of γCaMKII PV-KO mice.
(A) Example traces before (light traces) and 25 min after (dark traces) the TBS stimulation.
(B) Normalized spike transmission probability before and after the TBS stimulation in WT (black) and γCaMKII PV-KO (red) mice. Note that the spike transmission probability before the TBS stimulation between these two groups was adjusted to a similar level (see STAR Methods).
(C) The summary data measured 21–30 min after the TBS stimulation (n = 5–6 cells from 3–4 mice/group).
(D) Immunostaining of pGluR1 (S831) in the PV-positive neurons (dashed circles) in the CA1 region of WT and PV-KO mice 1.5 h after the contextual fear conditioning (CFC) training or naive conditioning.
Summary data are shown at the right (n = 118–152 cells from 5 mice/group). **p < 0.01 and ****p < 0.0001 (unpaired Student’s t test or one-way ANOVA followed by Turkey’s test). Scale bar: 50 μm. See also Figure S9.

