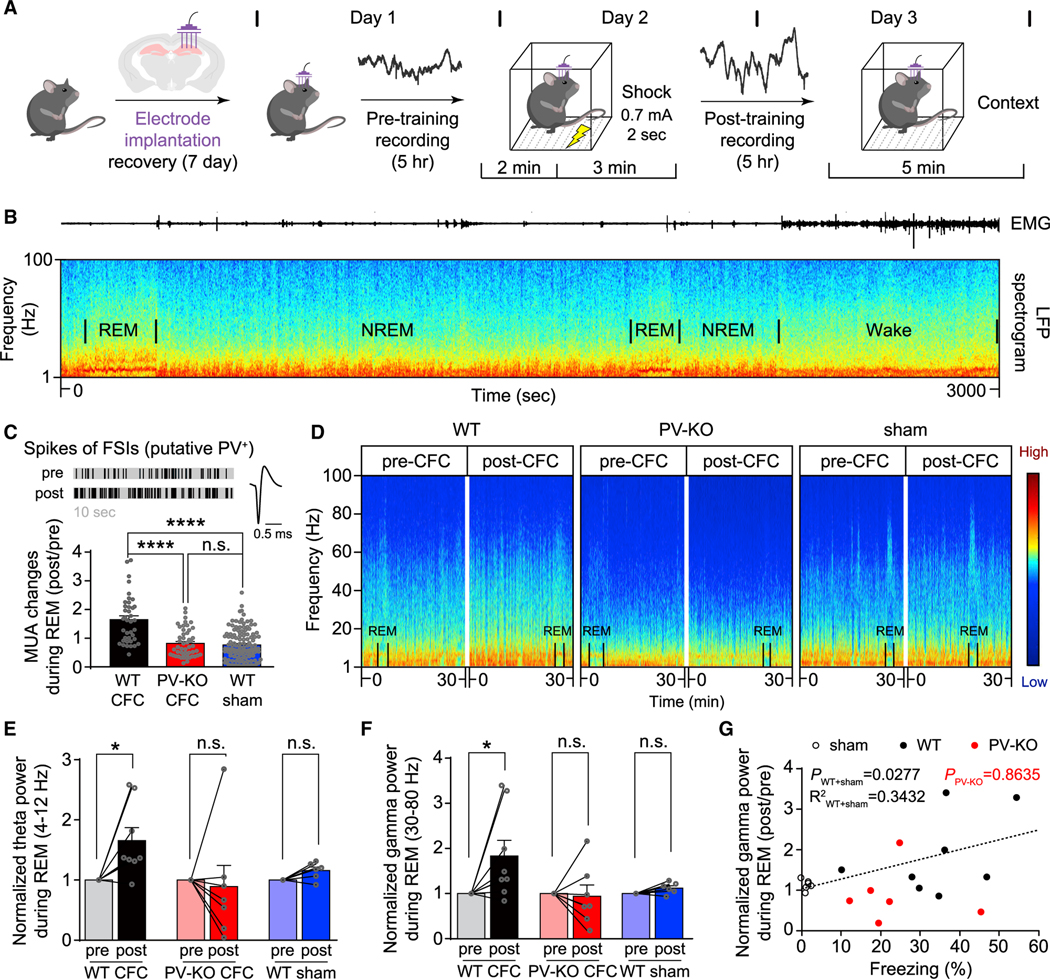
Figure 7. Impaired experience-dependent oscillations in the hippocampus of γCaMKII PV-KO mice.

(A) The hippocampal CA1 region was recorded for 5 h pre-CFC and then recorded for 5 h post-CFC (the recordings were performed at the same time of day, see STAR Methods).
(B) Representative local field potential (LFP) spectrogram (bottom) and corresponding EMG trace (top) measured during a typical 50-min sleep-wake period in a WT mouse; REM and non-REM (NREM) periods are indicated.
(C) Top left, representative MUA of the fast-spiking interneurons (FSIs, putative PV+ interneurons) during REM (10 s) in a WT mouse (pre-and post-CFC training); top right, representative trace of a spike of FSIs in WT mice. Bottom, summary of MUA changes (post/pre) for FSIs during REM (the first 30 s for each REM); compared to the groups of PV-KO and sham-treated WT mice, MUA of FSIs increased significantly in the WT group following CFC. n = 39–122 REMs from 2–4 mice/group, ****p < 0.0001 (one-way ANOVA test).
(D) Representative spectrograms waves measured in 30 min epochs pre- (left) and post-training (right) in WT, PV-KO, and sham-treated WT mice; the color represents relative power intensity (dB).
(E and F) Normalized theta wave (E) and gamma wave (F) power was measured before and after training in WT, PV-KO, and sham-treated WT mice. n = 6–8 mice/group, *p < 0.05 (Wilcoxon matched-pairs signed-rank test).
(G) Changes of gamma band power (post/pre) during REM are plotted against freezing (%) for each WT, PV-KO, and sham-treated WT mouse, note that one recorded mouse (PV-KO) was not followed by the retrieval test. Black circles: the WT sham group (n = 6 mice), black dots: the WT group (n = 8 mice), red dots: PV-KO group (n = 6 mice). PWT+sham = 0.0277, R2WT+sham = 0.3432; PPV-KO = 0.8635, and the Bonferroni-corrected p values indicate the results of a Spearman rank-order test.
See also Figures S10–S12.
