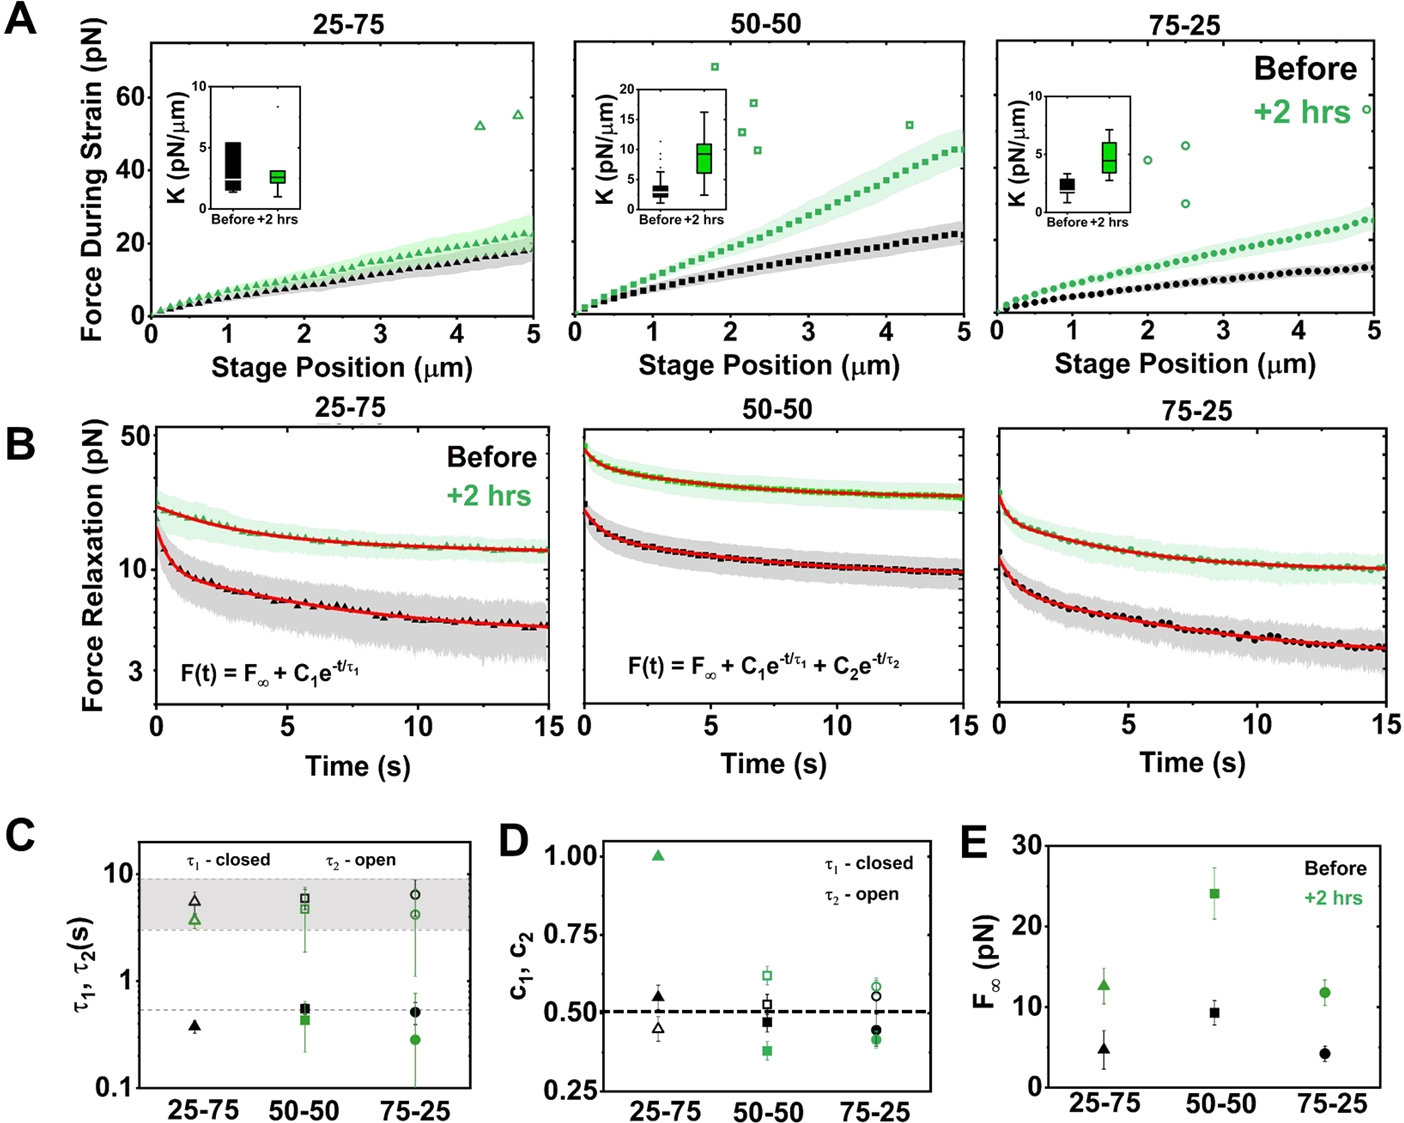
Figure 3.

Myosin-driven restructuring increases the nonlinear force response and suppresses relaxation of actin–microtubule composites. (A) Average force F(x) exerted on the bead during nonlinear strain, measured before (black) and 2 h after (green) myosin activation, for composites with actin–tubulin percentages of 25–75 (left), 50–50 (middle), and 75–25 (right). Shaded regions along each curve indicate standard error. Insets: boxplots of differential modulus, K = dF/dx, found as the slope of F(x) for each trial. (B) Relaxation of force versus time following strain, measured before and 2 h after motor activation. Nearly all curves are well fit to a sum of two exponentials and a nonzero offset: F(t) = F∞ + C1e−t/τ1 + C2e−t/τ2. The 25–75 relaxation after activation fits to a single exponential. Fits are shown as red lines. (C) Time constants corresponding to fast (τ1, closed symbols) and slow (τ2, open symbols) modes determined from fits in (B) for relaxations measured before (black) and 2 h after (green) activation. The dashed line corresponds to predicted actin bending time scale τB, and the gray region corresponds to previously measured reptation times for steady-state composites. (D) Relative contributions of the fast (c1) and slow (c2) modes determined from the fits in (B). Dashed horizontal line indicates equal contribution from both modes. (E) F∞ determined from the fits shown in (B), corresponding to the force that is sustained at the end of the relaxation period.
