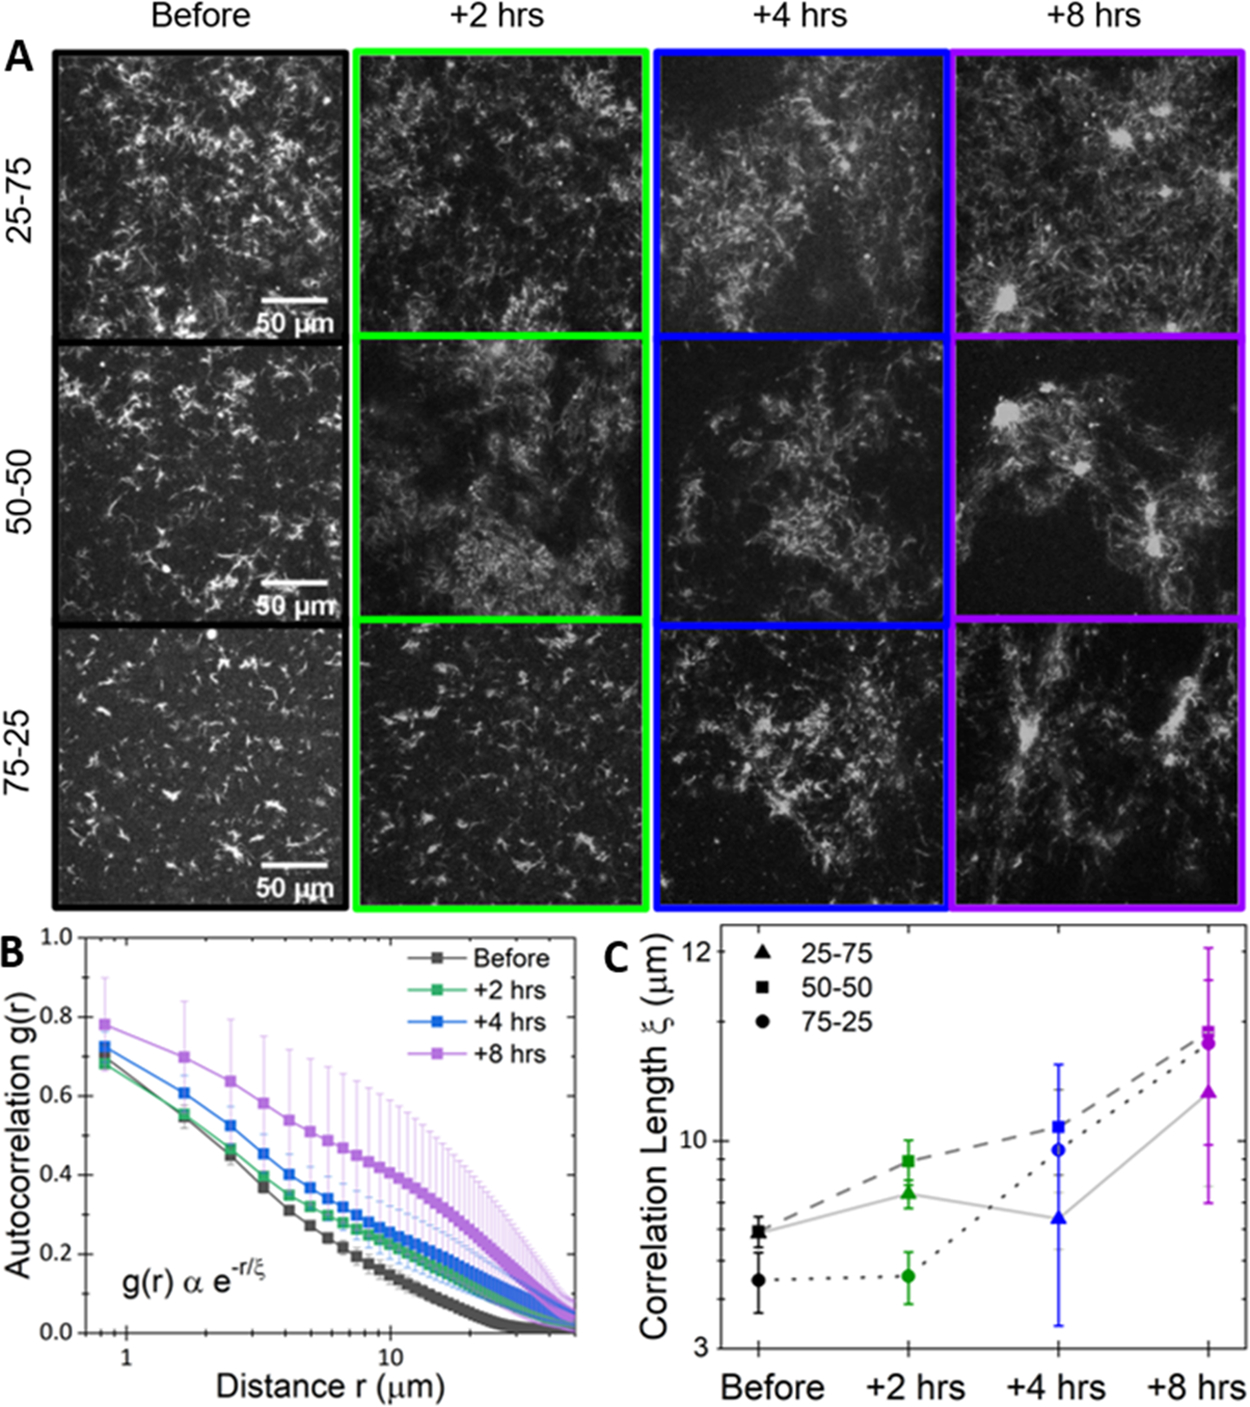
Figure 4.

Myosin activity drives sustained mesoscale clustering in actin–microtubule composites. (A) Representative 512 pixel × 512 pixel fluorescence confocal micrographs of rhodamine-labeled microtubules in actin–microtubule composites with actin–tubulin molar percentages of 25–75 (top), 50–50 (middle), and 75–25 (right). Images were acquired with 568 nm illumination at varying times relative to myosin activation: before (black) and 2 h (green), 4 h (blue), and 8 h (purple) after. (B) Average autocorrelation curves g(r), computed from five images for each time point, for the 50–50 composite. Error bars are standard error. Curves are fit to the equation shown to determine the correlation length ξ for each composite and time shown in panel C. (C) Average correlation lengths ξ for 25–75 (triangles), 50–50 (squares), and 75–25 (circles) composites at each time shown in (A).
